Bermudan vs Ghanaian Births to Unmarried Women
COMPARE
Bermudan
Ghanaian
Births to Unmarried Women
Births to Unmarried Women Comparison
Bermudans
Ghanaians
35.5%
BIRTHS TO UNMARRIED WOMEN
0.6/ 100
METRIC RATING
249th/ 347
METRIC RANK
34.3%
BIRTHS TO UNMARRIED WOMEN
3.1/ 100
METRIC RATING
230th/ 347
METRIC RANK
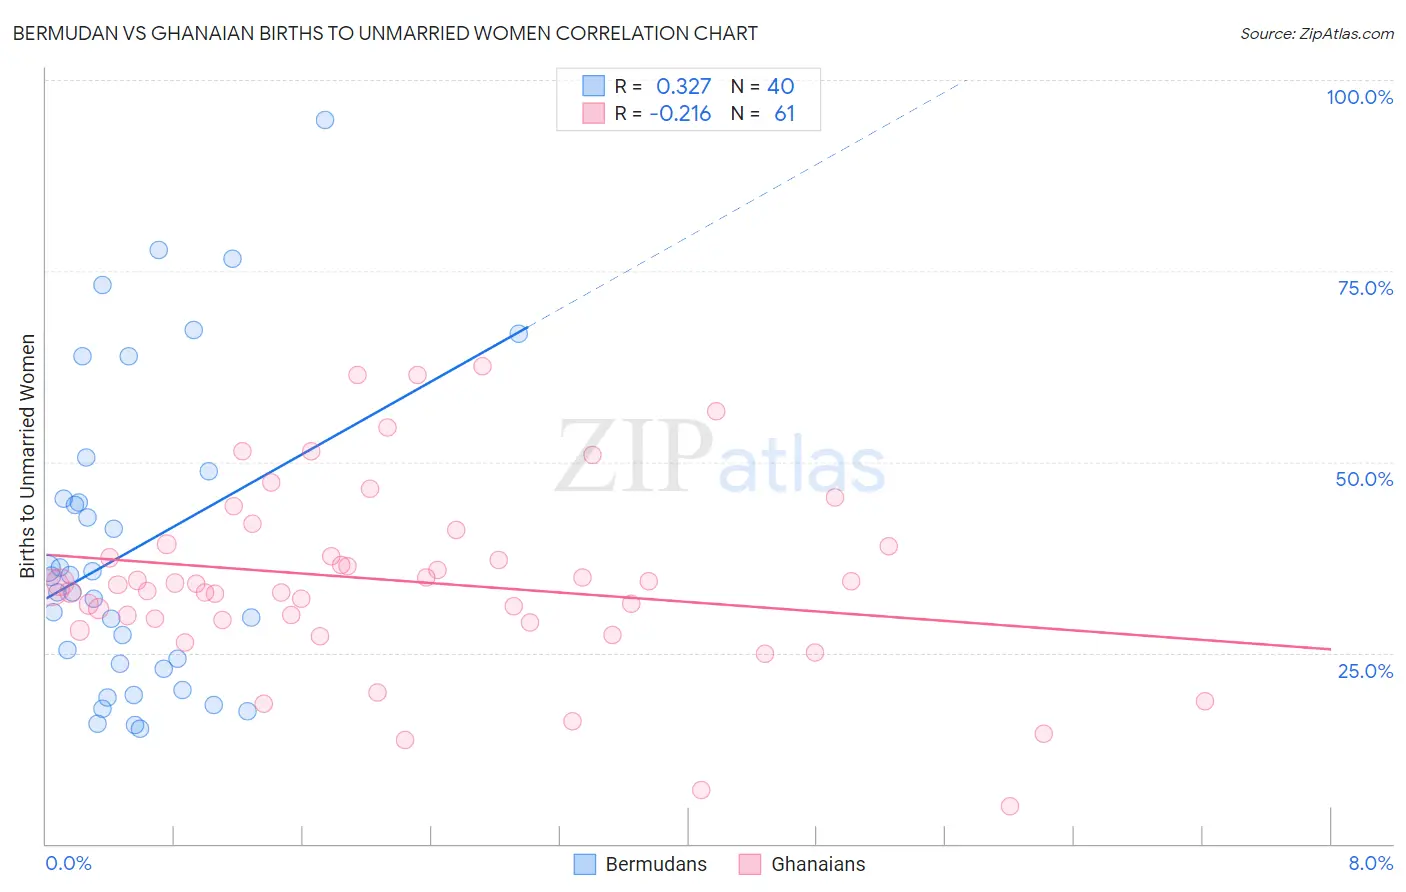
Bermudan vs Ghanaian Births to Unmarried Women Correlation Chart
The statistical analysis conducted on geographies consisting of 54,991,721 people shows a mild positive correlation between the proportion of Bermudans and percentage of births to unmarried women in the United States with a correlation coefficient (R) of 0.327 and weighted average of 35.5%. Similarly, the statistical analysis conducted on geographies consisting of 184,401,191 people shows a weak negative correlation between the proportion of Ghanaians and percentage of births to unmarried women in the United States with a correlation coefficient (R) of -0.216 and weighted average of 34.3%, a difference of 3.7%.
Births to Unmarried Women Correlation Summary
| Measurement | Bermudan | Ghanaian |
| Minimum | 15.1% | 4.9% |
| Maximum | 94.7% | 62.6% |
| Range | 79.6% | 57.7% |
| Mean | 38.7% | 34.4% |
| Median | 34.0% | 33.9% |
| Interquartile 25% (IQ1) | 23.2% | 29.2% |
| Interquartile 75% (IQ3) | 46.9% | 39.1% |
| Interquartile Range (IQR) | 23.7% | 9.9% |
| Standard Deviation (Sample) | 20.2% | 12.1% |
| Standard Deviation (Population) | 20.0% | 12.0% |
Demographics Similar to Bermudans and Ghanaians by Births to Unmarried Women
In terms of births to unmarried women, the demographic groups most similar to Bermudans are Nonimmigrants (35.5%, a difference of 0.010%), Immigrants from Nigeria (35.4%, a difference of 0.34%), Nigerian (35.3%, a difference of 0.55%), Shoshone (35.3%, a difference of 0.66%), and Guyanese (35.2%, a difference of 1.0%). Similarly, the demographic groups most similar to Ghanaians are Immigrants from Sierra Leone (34.2%, a difference of 0.020%), Native Hawaiian (34.3%, a difference of 0.14%), French Canadian (34.4%, a difference of 0.44%), Bangladeshi (34.4%, a difference of 0.46%), and Immigrants from Zaire (34.5%, a difference of 0.70%).
| Demographics | Rating | Rank | Births to Unmarried Women |
| Immigrants | Sierra Leone | 3.1 /100 | #229 | Tragic 34.2% |
| Ghanaians | 3.1 /100 | #230 | Tragic 34.3% |
| Native Hawaiians | 2.9 /100 | #231 | Tragic 34.3% |
| French Canadians | 2.5 /100 | #232 | Tragic 34.4% |
| Bangladeshis | 2.5 /100 | #233 | Tragic 34.4% |
| Immigrants | Zaire | 2.3 /100 | #234 | Tragic 34.5% |
| Immigrants | Ghana | 2.2 /100 | #235 | Tragic 34.5% |
| Immigrants | Cameroon | 1.6 /100 | #236 | Tragic 34.7% |
| Marshallese | 1.6 /100 | #237 | Tragic 34.8% |
| Immigrants | Cambodia | 1.6 /100 | #238 | Tragic 34.8% |
| Sierra Leoneans | 1.4 /100 | #239 | Tragic 34.9% |
| Immigrants | Middle Africa | 1.2 /100 | #240 | Tragic 34.9% |
| Immigrants | Guyana | 1.2 /100 | #241 | Tragic 35.0% |
| Indonesians | 1.2 /100 | #242 | Tragic 35.0% |
| Japanese | 0.9 /100 | #243 | Tragic 35.2% |
| Guyanese | 0.9 /100 | #244 | Tragic 35.2% |
| Shoshone | 0.8 /100 | #245 | Tragic 35.3% |
| Nigerians | 0.7 /100 | #246 | Tragic 35.3% |
| Immigrants | Nigeria | 0.7 /100 | #247 | Tragic 35.4% |
| Immigrants | Nonimmigrants | 0.6 /100 | #248 | Tragic 35.5% |
| Bermudans | 0.6 /100 | #249 | Tragic 35.5% |