Celtic vs Scandinavian Births to Unmarried Women
COMPARE
Celtic
Scandinavian
Births to Unmarried Women
Births to Unmarried Women Comparison
Celtics
Scandinavians
33.3%
BIRTHS TO UNMARRIED WOMEN
10.2/ 100
METRIC RATING
212th/ 347
METRIC RANK
29.8%
BIRTHS TO UNMARRIED WOMEN
92.7/ 100
METRIC RATING
113th/ 347
METRIC RANK
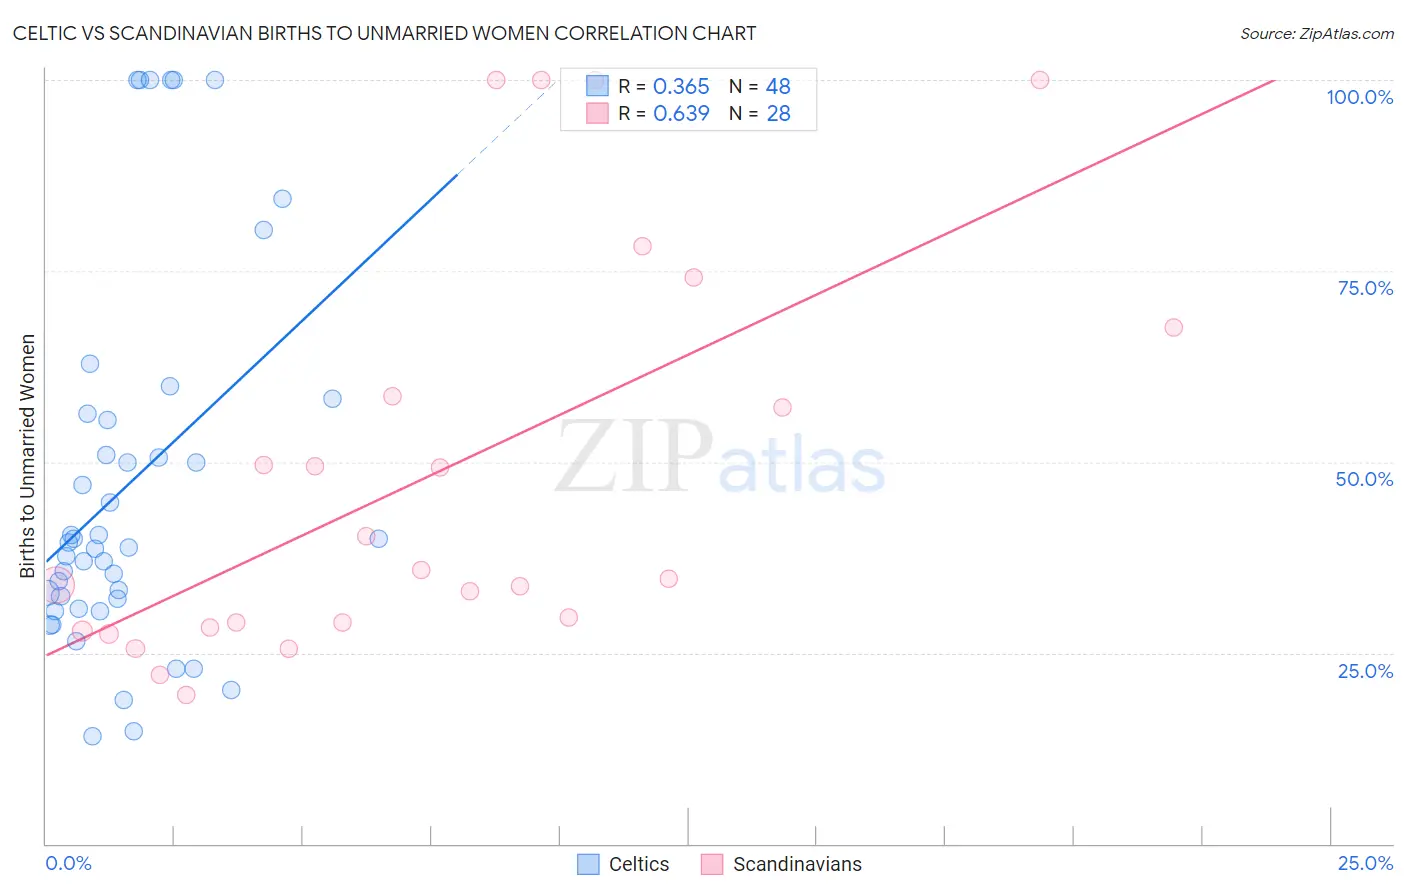
Celtic vs Scandinavian Births to Unmarried Women Correlation Chart
The statistical analysis conducted on geographies consisting of 162,463,744 people shows a mild positive correlation between the proportion of Celtics and percentage of births to unmarried women in the United States with a correlation coefficient (R) of 0.365 and weighted average of 33.3%. Similarly, the statistical analysis conducted on geographies consisting of 430,139,153 people shows a significant positive correlation between the proportion of Scandinavians and percentage of births to unmarried women in the United States with a correlation coefficient (R) of 0.639 and weighted average of 29.8%, a difference of 11.9%.
Births to Unmarried Women Correlation Summary
| Measurement | Celtic | Scandinavian |
| Minimum | 14.0% | 19.6% |
| Maximum | 100.0% | 100.0% |
| Range | 86.0% | 80.4% |
| Mean | 47.2% | 48.5% |
| Median | 39.1% | 35.3% |
| Interquartile 25% (IQ1) | 31.5% | 28.6% |
| Interquartile 75% (IQ3) | 55.9% | 63.0% |
| Interquartile Range (IQR) | 24.4% | 34.4% |
| Standard Deviation (Sample) | 24.7% | 26.4% |
| Standard Deviation (Population) | 24.5% | 25.9% |
Similar Demographics by Births to Unmarried Women
Demographics Similar to Celtics by Births to Unmarried Women
In terms of births to unmarried women, the demographic groups most similar to Celtics are Ecuadorian (33.3%, a difference of 0.070%), White/Caucasian (33.3%, a difference of 0.12%), Scotch-Irish (33.3%, a difference of 0.12%), Immigrants from Costa Rica (33.4%, a difference of 0.19%), and Slovak (33.4%, a difference of 0.24%).
| Demographics | Rating | Rank | Births to Unmarried Women |
| German Russians | 13.1 /100 | #205 | Poor 33.1% |
| Uruguayans | 12.8 /100 | #206 | Poor 33.1% |
| Immigrants | Sudan | 11.5 /100 | #207 | Poor 33.2% |
| Hawaiians | 11.3 /100 | #208 | Poor 33.2% |
| Whites/Caucasians | 10.7 /100 | #209 | Poor 33.3% |
| Scotch-Irish | 10.7 /100 | #210 | Poor 33.3% |
| Ecuadorians | 10.5 /100 | #211 | Poor 33.3% |
| Celtics | 10.2 /100 | #212 | Poor 33.3% |
| Immigrants | Costa Rica | 9.5 /100 | #213 | Tragic 33.4% |
| Slovaks | 9.3 /100 | #214 | Tragic 33.4% |
| French | 8.7 /100 | #215 | Tragic 33.4% |
| Nepalese | 7.8 /100 | #216 | Tragic 33.5% |
| Spaniards | 7.0 /100 | #217 | Tragic 33.6% |
| Immigrants | Ecuador | 5.9 /100 | #218 | Tragic 33.7% |
| Alsatians | 5.4 /100 | #219 | Tragic 33.8% |
Demographics Similar to Scandinavians by Births to Unmarried Women
In terms of births to unmarried women, the demographic groups most similar to Scandinavians are Immigrants from Croatia (29.8%, a difference of 0.060%), Basque (29.7%, a difference of 0.10%), Immigrants from Hungary (29.7%, a difference of 0.11%), Immigrants from Ethiopia (29.7%, a difference of 0.25%), and Greek (29.7%, a difference of 0.28%).
| Demographics | Rating | Rank | Births to Unmarried Women |
| Swedes | 93.8 /100 | #106 | Exceptional 29.6% |
| Immigrants | Brazil | 93.7 /100 | #107 | Exceptional 29.6% |
| Paraguayans | 93.5 /100 | #108 | Exceptional 29.7% |
| Greeks | 93.4 /100 | #109 | Exceptional 29.7% |
| Immigrants | Ethiopia | 93.4 /100 | #110 | Exceptional 29.7% |
| Immigrants | Hungary | 93.0 /100 | #111 | Exceptional 29.7% |
| Basques | 93.0 /100 | #112 | Exceptional 29.7% |
| Scandinavians | 92.7 /100 | #113 | Exceptional 29.8% |
| Immigrants | Croatia | 92.6 /100 | #114 | Exceptional 29.8% |
| Ethiopians | 91.9 /100 | #115 | Exceptional 29.8% |
| Immigrants | Italy | 91.7 /100 | #116 | Exceptional 29.9% |
| Immigrants | Netherlands | 91.1 /100 | #117 | Exceptional 29.9% |
| Immigrants | Norway | 91.0 /100 | #118 | Exceptional 29.9% |
| Argentineans | 90.5 /100 | #119 | Exceptional 30.0% |
| Ugandans | 89.2 /100 | #120 | Excellent 30.1% |