Belizean vs Dutch West Indian Family Households with Children
COMPARE
Belizean
Dutch West Indian
Family Households with Children
Family Households with Children Comparison
Belizeans
Dutch West Indians
27.8%
FAMILY HOUSEHOLDS WITH CHILDREN
90.0/ 100
METRIC RATING
127th/ 347
METRIC RANK
27.2%
FAMILY HOUSEHOLDS WITH CHILDREN
15.8/ 100
METRIC RATING
209th/ 347
METRIC RANK
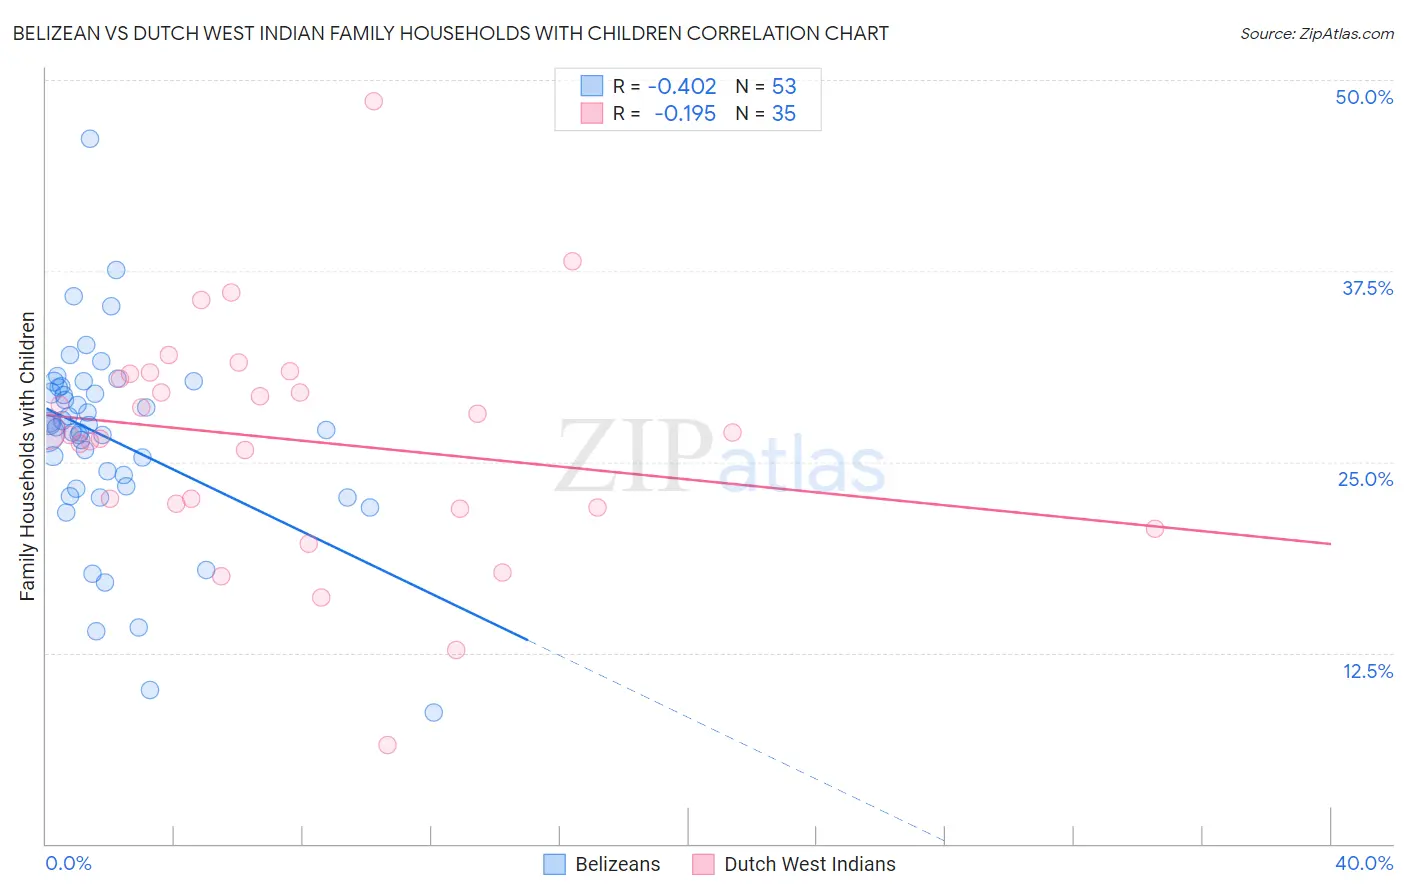
Belizean vs Dutch West Indian Family Households with Children Correlation Chart
The statistical analysis conducted on geographies consisting of 144,146,110 people shows a moderate negative correlation between the proportion of Belizeans and percentage of family households with children in the United States with a correlation coefficient (R) of -0.402 and weighted average of 27.8%. Similarly, the statistical analysis conducted on geographies consisting of 85,765,288 people shows a poor negative correlation between the proportion of Dutch West Indians and percentage of family households with children in the United States with a correlation coefficient (R) of -0.195 and weighted average of 27.2%, a difference of 2.1%.
Family Households with Children Correlation Summary
| Measurement | Belizean | Dutch West Indian |
| Minimum | 8.6% | 6.5% |
| Maximum | 46.2% | 48.6% |
| Range | 37.6% | 42.2% |
| Mean | 26.4% | 26.5% |
| Median | 27.3% | 26.9% |
| Interquartile 25% (IQ1) | 23.3% | 22.0% |
| Interquartile 75% (IQ3) | 29.9% | 30.8% |
| Interquartile Range (IQR) | 6.6% | 8.7% |
| Standard Deviation (Sample) | 6.5% | 7.7% |
| Standard Deviation (Population) | 6.4% | 7.5% |
Similar Demographics by Family Households with Children
Demographics Similar to Belizeans by Family Households with Children
In terms of family households with children, the demographic groups most similar to Belizeans are Syrian (27.8%, a difference of 0.020%), Immigrants from Ethiopia (27.8%, a difference of 0.030%), Immigrants from Eritrea (27.8%, a difference of 0.040%), Immigrants from Singapore (27.8%, a difference of 0.050%), and Ecuadorian (27.8%, a difference of 0.050%).
| Demographics | Rating | Rank | Family Households with Children |
| Europeans | 95.4 /100 | #120 | Exceptional 27.9% |
| Immigrants | Western Asia | 93.6 /100 | #121 | Exceptional 27.9% |
| Immigrants | Zimbabwe | 92.8 /100 | #122 | Exceptional 27.8% |
| Immigrants | Northern Africa | 91.8 /100 | #123 | Exceptional 27.8% |
| Immigrants | Singapore | 90.8 /100 | #124 | Exceptional 27.8% |
| Ecuadorians | 90.8 /100 | #125 | Exceptional 27.8% |
| Immigrants | Ethiopia | 90.5 /100 | #126 | Exceptional 27.8% |
| Belizeans | 90.0 /100 | #127 | Exceptional 27.8% |
| Syrians | 89.7 /100 | #128 | Excellent 27.8% |
| Immigrants | Eritrea | 89.4 /100 | #129 | Excellent 27.8% |
| Cajuns | 87.6 /100 | #130 | Excellent 27.7% |
| Lebanese | 87.4 /100 | #131 | Excellent 27.7% |
| Immigrants | Belize | 85.7 /100 | #132 | Excellent 27.7% |
| Iranians | 85.2 /100 | #133 | Excellent 27.7% |
| Immigrants | Panama | 84.9 /100 | #134 | Excellent 27.7% |
Demographics Similar to Dutch West Indians by Family Households with Children
In terms of family households with children, the demographic groups most similar to Dutch West Indians are Immigrants from Poland (27.2%, a difference of 0.030%), Immigrants from Ukraine (27.2%, a difference of 0.060%), Welsh (27.2%, a difference of 0.070%), Immigrants from Dominica (27.2%, a difference of 0.080%), and Okinawan (27.2%, a difference of 0.090%).
| Demographics | Rating | Rank | Family Households with Children |
| Americans | 22.8 /100 | #202 | Fair 27.3% |
| Kiowa | 22.2 /100 | #203 | Fair 27.3% |
| Immigrants | Sudan | 21.6 /100 | #204 | Fair 27.3% |
| Immigrants | Haiti | 20.3 /100 | #205 | Fair 27.2% |
| Immigrants | Micronesia | 20.2 /100 | #206 | Fair 27.2% |
| Haitians | 19.8 /100 | #207 | Poor 27.2% |
| Immigrants | Poland | 16.4 /100 | #208 | Poor 27.2% |
| Dutch West Indians | 15.8 /100 | #209 | Poor 27.2% |
| Immigrants | Ukraine | 14.4 /100 | #210 | Poor 27.2% |
| Welsh | 14.2 /100 | #211 | Poor 27.2% |
| Immigrants | Dominica | 13.9 /100 | #212 | Poor 27.2% |
| Okinawans | 13.7 /100 | #213 | Poor 27.2% |
| Africans | 13.0 /100 | #214 | Poor 27.2% |
| Northern Europeans | 12.8 /100 | #215 | Poor 27.2% |
| Cubans | 12.2 /100 | #216 | Poor 27.1% |