Belizean vs Filipino Family Households with Children
COMPARE
Belizean
Filipino
Family Households with Children
Family Households with Children Comparison
Belizeans
Filipinos
27.8%
FAMILY HOUSEHOLDS WITH CHILDREN
90.0/ 100
METRIC RATING
127th/ 347
METRIC RANK
28.6%
FAMILY HOUSEHOLDS WITH CHILDREN
99.9/ 100
METRIC RATING
64th/ 347
METRIC RANK
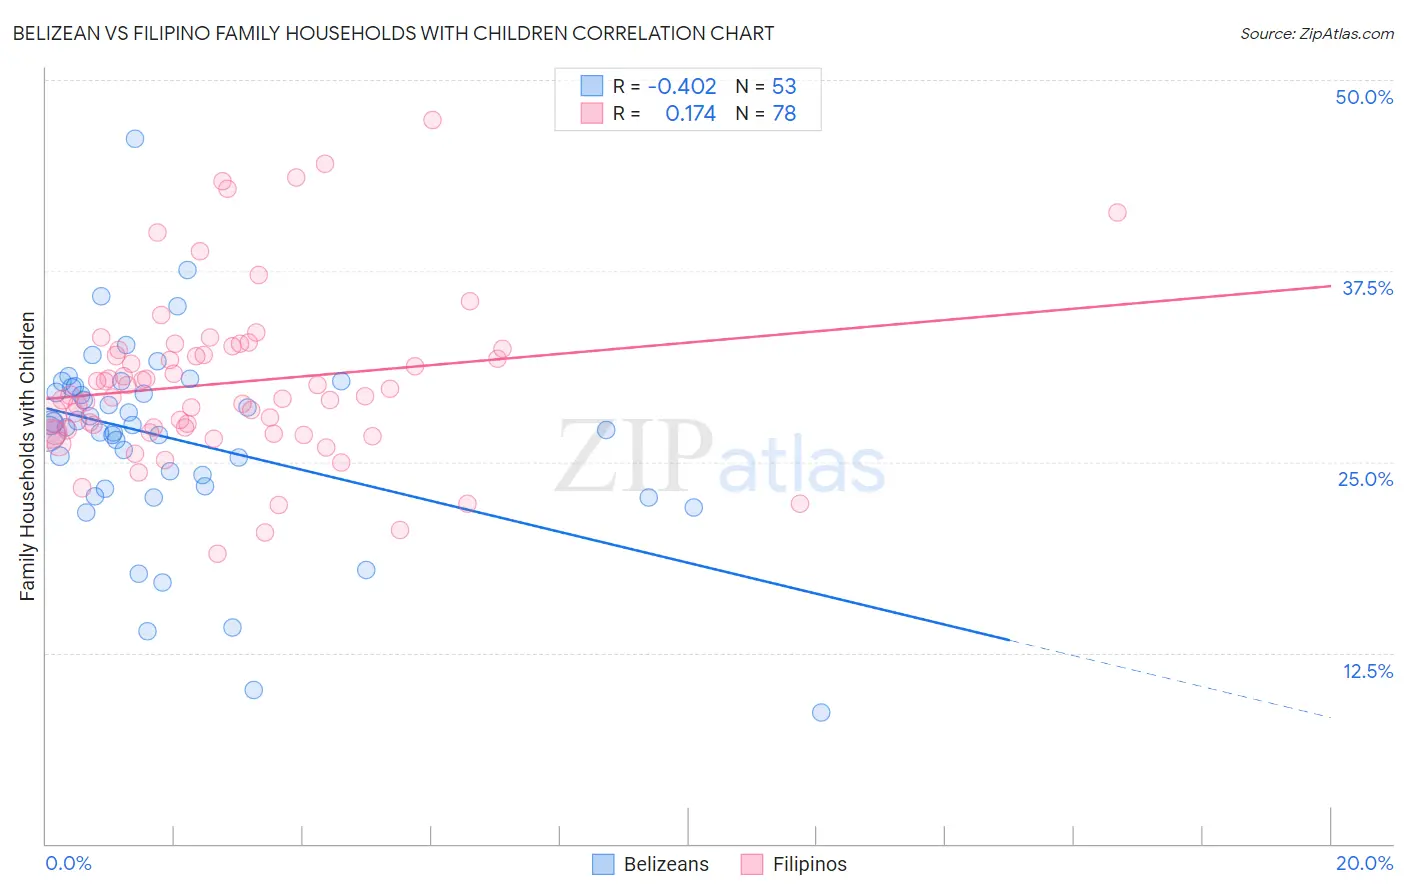
Belizean vs Filipino Family Households with Children Correlation Chart
The statistical analysis conducted on geographies consisting of 144,146,110 people shows a moderate negative correlation between the proportion of Belizeans and percentage of family households with children in the United States with a correlation coefficient (R) of -0.402 and weighted average of 27.8%. Similarly, the statistical analysis conducted on geographies consisting of 254,080,419 people shows a poor positive correlation between the proportion of Filipinos and percentage of family households with children in the United States with a correlation coefficient (R) of 0.174 and weighted average of 28.6%, a difference of 2.8%.
Family Households with Children Correlation Summary
| Measurement | Belizean | Filipino |
| Minimum | 8.6% | 19.0% |
| Maximum | 46.2% | 47.3% |
| Range | 37.6% | 28.4% |
| Mean | 26.4% | 30.2% |
| Median | 27.3% | 29.3% |
| Interquartile 25% (IQ1) | 23.3% | 26.9% |
| Interquartile 75% (IQ3) | 29.9% | 32.4% |
| Interquartile Range (IQR) | 6.6% | 5.4% |
| Standard Deviation (Sample) | 6.5% | 5.5% |
| Standard Deviation (Population) | 6.4% | 5.5% |
Similar Demographics by Family Households with Children
Demographics Similar to Belizeans by Family Households with Children
In terms of family households with children, the demographic groups most similar to Belizeans are Syrian (27.8%, a difference of 0.020%), Immigrants from Ethiopia (27.8%, a difference of 0.030%), Immigrants from Eritrea (27.8%, a difference of 0.040%), Immigrants from Singapore (27.8%, a difference of 0.050%), and Ecuadorian (27.8%, a difference of 0.050%).
| Demographics | Rating | Rank | Family Households with Children |
| Europeans | 95.4 /100 | #120 | Exceptional 27.9% |
| Immigrants | Western Asia | 93.6 /100 | #121 | Exceptional 27.9% |
| Immigrants | Zimbabwe | 92.8 /100 | #122 | Exceptional 27.8% |
| Immigrants | Northern Africa | 91.8 /100 | #123 | Exceptional 27.8% |
| Immigrants | Singapore | 90.8 /100 | #124 | Exceptional 27.8% |
| Ecuadorians | 90.8 /100 | #125 | Exceptional 27.8% |
| Immigrants | Ethiopia | 90.5 /100 | #126 | Exceptional 27.8% |
| Belizeans | 90.0 /100 | #127 | Exceptional 27.8% |
| Syrians | 89.7 /100 | #128 | Excellent 27.8% |
| Immigrants | Eritrea | 89.4 /100 | #129 | Excellent 27.8% |
| Cajuns | 87.6 /100 | #130 | Excellent 27.7% |
| Lebanese | 87.4 /100 | #131 | Excellent 27.7% |
| Immigrants | Belize | 85.7 /100 | #132 | Excellent 27.7% |
| Iranians | 85.2 /100 | #133 | Excellent 27.7% |
| Immigrants | Panama | 84.9 /100 | #134 | Excellent 27.7% |
Demographics Similar to Filipinos by Family Households with Children
In terms of family households with children, the demographic groups most similar to Filipinos are Immigrants from Lebanon (28.6%, a difference of 0.070%), Immigrants from Ghana (28.6%, a difference of 0.080%), Egyptian (28.6%, a difference of 0.080%), Honduran (28.5%, a difference of 0.080%), and Immigrants from Egypt (28.5%, a difference of 0.080%).
| Demographics | Rating | Rank | Family Households with Children |
| Danes | 100.0 /100 | #57 | Exceptional 28.7% |
| Hawaiians | 100.0 /100 | #58 | Exceptional 28.7% |
| Immigrants | Nigeria | 100.0 /100 | #59 | Exceptional 28.6% |
| Hmong | 99.9 /100 | #60 | Exceptional 28.6% |
| Immigrants | Ghana | 99.9 /100 | #61 | Exceptional 28.6% |
| Egyptians | 99.9 /100 | #62 | Exceptional 28.6% |
| Immigrants | Lebanon | 99.9 /100 | #63 | Exceptional 28.6% |
| Filipinos | 99.9 /100 | #64 | Exceptional 28.6% |
| Hondurans | 99.9 /100 | #65 | Exceptional 28.5% |
| Immigrants | Egypt | 99.9 /100 | #66 | Exceptional 28.5% |
| Ghanaians | 99.9 /100 | #67 | Exceptional 28.5% |
| Houma | 99.9 /100 | #68 | Exceptional 28.5% |
| Immigrants | Korea | 99.9 /100 | #69 | Exceptional 28.5% |
| Immigrants | Honduras | 99.9 /100 | #70 | Exceptional 28.5% |
| Burmese | 99.9 /100 | #71 | Exceptional 28.5% |