Immigrants from Uruguay vs Dutch West Indian Family Households with Children
COMPARE
Immigrants from Uruguay
Dutch West Indian
Family Households with Children
Family Households with Children Comparison
Immigrants from Uruguay
Dutch West Indians
27.4%
FAMILY HOUSEHOLDS WITH CHILDREN
37.7/ 100
METRIC RATING
190th/ 347
METRIC RANK
27.2%
FAMILY HOUSEHOLDS WITH CHILDREN
15.8/ 100
METRIC RATING
209th/ 347
METRIC RANK
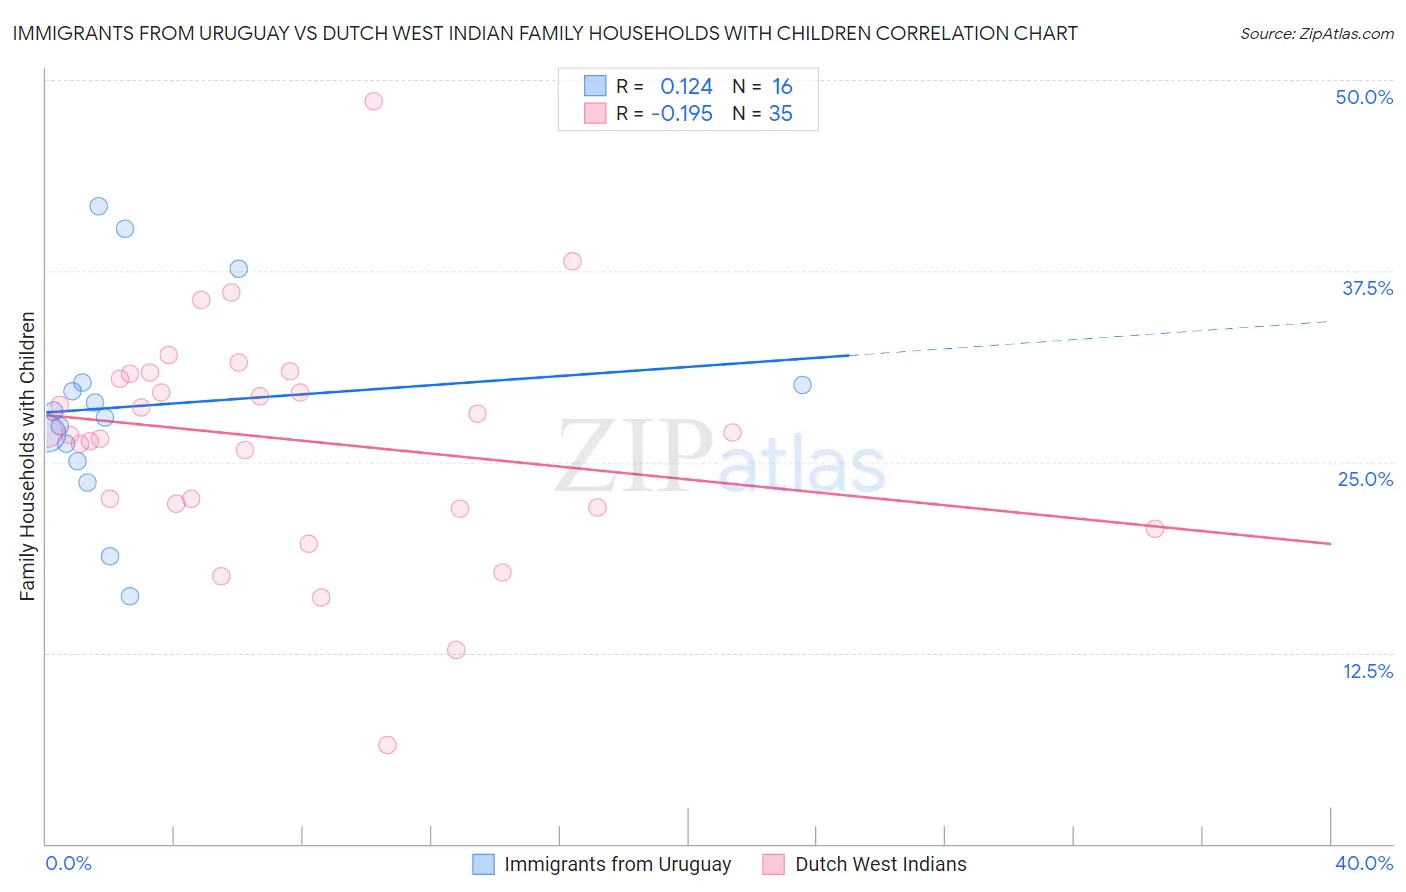
Immigrants from Uruguay vs Dutch West Indian Family Households with Children Correlation Chart
The statistical analysis conducted on geographies consisting of 133,231,566 people shows a poor positive correlation between the proportion of Immigrants from Uruguay and percentage of family households with children in the United States with a correlation coefficient (R) of 0.124 and weighted average of 27.4%. Similarly, the statistical analysis conducted on geographies consisting of 85,765,288 people shows a poor negative correlation between the proportion of Dutch West Indians and percentage of family households with children in the United States with a correlation coefficient (R) of -0.195 and weighted average of 27.2%, a difference of 0.65%.
Family Households with Children Correlation Summary
| Measurement | Immigrants from Uruguay | Dutch West Indian |
| Minimum | 16.2% | 6.5% |
| Maximum | 41.7% | 48.6% |
| Range | 25.5% | 42.2% |
| Mean | 28.7% | 26.5% |
| Median | 28.1% | 26.9% |
| Interquartile 25% (IQ1) | 25.6% | 22.0% |
| Interquartile 75% (IQ3) | 30.1% | 30.8% |
| Interquartile Range (IQR) | 4.5% | 8.7% |
| Standard Deviation (Sample) | 6.8% | 7.7% |
| Standard Deviation (Population) | 6.6% | 7.5% |
Demographics Similar to Immigrants from Uruguay and Dutch West Indians by Family Households with Children
In terms of family households with children, the demographic groups most similar to Immigrants from Uruguay are Sudanese (27.4%, a difference of 0.0%), Pennsylvania German (27.4%, a difference of 0.0%), Immigrants from Israel (27.4%, a difference of 0.010%), Swedish (27.4%, a difference of 0.020%), and Immigrants from Iran (27.4%, a difference of 0.040%). Similarly, the demographic groups most similar to Dutch West Indians are Immigrants from Poland (27.2%, a difference of 0.030%), Haitian (27.2%, a difference of 0.15%), Immigrants from Haiti (27.2%, a difference of 0.17%), Immigrants from Micronesia (27.2%, a difference of 0.17%), and Immigrants from Sudan (27.3%, a difference of 0.22%).
| Demographics | Rating | Rank | Family Households with Children |
| Immigrants | Israel | 37.9 /100 | #189 | Fair 27.4% |
| Immigrants | Uruguay | 37.7 /100 | #190 | Fair 27.4% |
| Sudanese | 37.6 /100 | #191 | Fair 27.4% |
| Pennsylvania Germans | 37.5 /100 | #192 | Fair 27.4% |
| Swedes | 36.9 /100 | #193 | Fair 27.4% |
| Immigrants | Iran | 36.1 /100 | #194 | Fair 27.4% |
| Crow | 35.7 /100 | #195 | Fair 27.4% |
| Cheyenne | 35.1 /100 | #196 | Fair 27.4% |
| Norwegians | 35.0 /100 | #197 | Fair 27.4% |
| Immigrants | Romania | 34.4 /100 | #198 | Fair 27.4% |
| English | 32.0 /100 | #199 | Fair 27.3% |
| Immigrants | Congo | 28.7 /100 | #200 | Fair 27.3% |
| Bhutanese | 25.1 /100 | #201 | Fair 27.3% |
| Americans | 22.8 /100 | #202 | Fair 27.3% |
| Kiowa | 22.2 /100 | #203 | Fair 27.3% |
| Immigrants | Sudan | 21.6 /100 | #204 | Fair 27.3% |
| Immigrants | Haiti | 20.3 /100 | #205 | Fair 27.2% |
| Immigrants | Micronesia | 20.2 /100 | #206 | Fair 27.2% |
| Haitians | 19.8 /100 | #207 | Poor 27.2% |
| Immigrants | Poland | 16.4 /100 | #208 | Poor 27.2% |
| Dutch West Indians | 15.8 /100 | #209 | Poor 27.2% |