Assyrian/Chaldean/Syriac vs Immigrants from Indonesia Married-couple Households
COMPARE
Assyrian/Chaldean/Syriac
Immigrants from Indonesia
Married-couple Households
Married-couple Households Comparison
Assyrians/Chaldeans/Syriacs
Immigrants from Indonesia
51.8%
MARRIED-COUPLE HOUSEHOLDS
100.0/ 100
METRIC RATING
4th/ 347
METRIC RANK
48.5%
MARRIED-COUPLE HOUSEHOLDS
99.2/ 100
METRIC RATING
58th/ 347
METRIC RANK
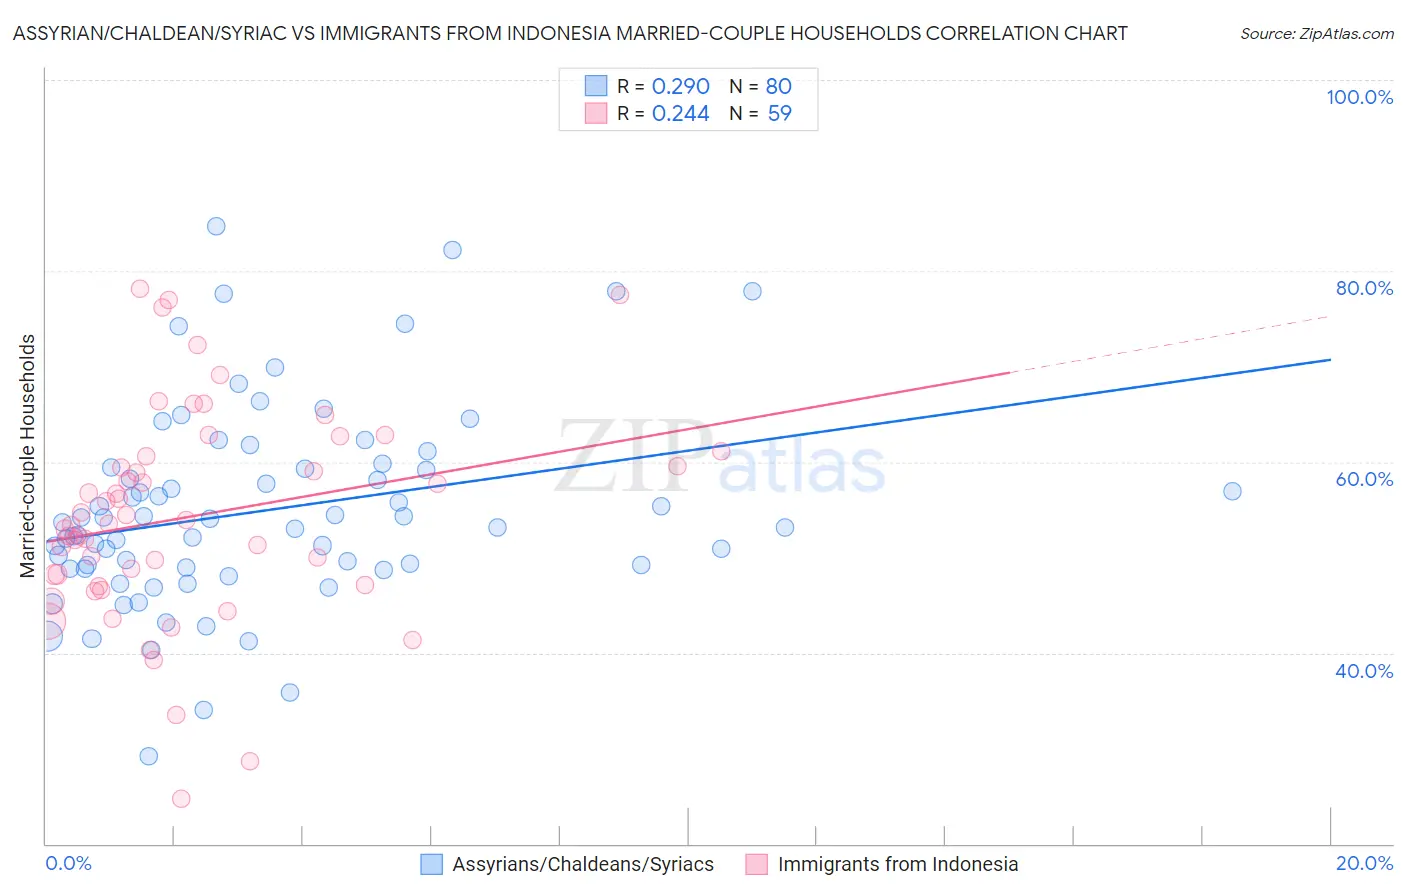
Assyrian/Chaldean/Syriac vs Immigrants from Indonesia Married-couple Households Correlation Chart
The statistical analysis conducted on geographies consisting of 110,294,582 people shows a weak positive correlation between the proportion of Assyrians/Chaldeans/Syriacs and percentage of married-couple family households in the United States with a correlation coefficient (R) of 0.290 and weighted average of 51.8%. Similarly, the statistical analysis conducted on geographies consisting of 215,718,845 people shows a weak positive correlation between the proportion of Immigrants from Indonesia and percentage of married-couple family households in the United States with a correlation coefficient (R) of 0.244 and weighted average of 48.5%, a difference of 6.7%.
Married-couple Households Correlation Summary
| Measurement | Assyrian/Chaldean/Syriac | Immigrants from Indonesia |
| Minimum | 29.2% | 24.7% |
| Maximum | 84.7% | 78.1% |
| Range | 55.5% | 53.5% |
| Mean | 54.9% | 54.3% |
| Median | 53.4% | 53.5% |
| Interquartile 25% (IQ1) | 48.9% | 47.1% |
| Interquartile 75% (IQ3) | 59.3% | 60.7% |
| Interquartile Range (IQR) | 10.4% | 13.6% |
| Standard Deviation (Sample) | 10.5% | 11.1% |
| Standard Deviation (Population) | 10.4% | 11.0% |
Similar Demographics by Married-couple Households
Demographics Similar to Assyrians/Chaldeans/Syriacs by Married-couple Households
In terms of married-couple households, the demographic groups most similar to Assyrians/Chaldeans/Syriacs are Thai (51.9%, a difference of 0.21%), Tongan (51.6%, a difference of 0.48%), Immigrants from Taiwan (52.4%, a difference of 1.2%), Danish (51.1%, a difference of 1.5%), and Filipino (51.0%, a difference of 1.7%).
| Demographics | Rating | Rank | Married-couple Households |
| Immigrants | India | 100.0 /100 | #1 | Exceptional 52.7% |
| Immigrants | Taiwan | 100.0 /100 | #2 | Exceptional 52.4% |
| Thais | 100.0 /100 | #3 | Exceptional 51.9% |
| Assyrians/Chaldeans/Syriacs | 100.0 /100 | #4 | Exceptional 51.8% |
| Tongans | 100.0 /100 | #5 | Exceptional 51.6% |
| Danes | 100.0 /100 | #6 | Exceptional 51.1% |
| Filipinos | 100.0 /100 | #7 | Exceptional 51.0% |
| Immigrants | South Central Asia | 100.0 /100 | #8 | Exceptional 50.6% |
| Pennsylvania Germans | 100.0 /100 | #9 | Exceptional 50.4% |
| Chinese | 100.0 /100 | #10 | Exceptional 50.4% |
| Immigrants | Pakistan | 100.0 /100 | #11 | Exceptional 50.1% |
| Swiss | 100.0 /100 | #12 | Exceptional 49.9% |
| Immigrants | Korea | 100.0 /100 | #13 | Exceptional 49.9% |
| Burmese | 100.0 /100 | #14 | Exceptional 49.8% |
| Koreans | 99.9 /100 | #15 | Exceptional 49.7% |
Demographics Similar to Immigrants from Indonesia by Married-couple Households
In terms of married-couple households, the demographic groups most similar to Immigrants from Indonesia are Polish (48.5%, a difference of 0.0%), Czechoslovakian (48.5%, a difference of 0.0%), Croatian (48.5%, a difference of 0.080%), Austrian (48.6%, a difference of 0.090%), and Immigrants from Northern Europe (48.6%, a difference of 0.090%).
| Demographics | Rating | Rank | Married-couple Households |
| Eastern Europeans | 99.3 /100 | #51 | Exceptional 48.6% |
| Irish | 99.3 /100 | #52 | Exceptional 48.6% |
| Whites/Caucasians | 99.3 /100 | #53 | Exceptional 48.6% |
| Immigrants | Lithuania | 99.3 /100 | #54 | Exceptional 48.6% |
| Austrians | 99.3 /100 | #55 | Exceptional 48.6% |
| Immigrants | Northern Europe | 99.3 /100 | #56 | Exceptional 48.6% |
| Poles | 99.2 /100 | #57 | Exceptional 48.5% |
| Immigrants | Indonesia | 99.2 /100 | #58 | Exceptional 48.5% |
| Czechoslovakians | 99.2 /100 | #59 | Exceptional 48.5% |
| Croatians | 99.1 /100 | #60 | Exceptional 48.5% |
| Bulgarians | 99.1 /100 | #61 | Exceptional 48.5% |
| Luxembourgers | 99.1 /100 | #62 | Exceptional 48.5% |
| Basques | 99.0 /100 | #63 | Exceptional 48.4% |
| Northern Europeans | 99.0 /100 | #64 | Exceptional 48.4% |
| Immigrants | Canada | 99.0 /100 | #65 | Exceptional 48.4% |