Aleut vs Vietnamese Married-couple Households
COMPARE
Aleut
Vietnamese
Married-couple Households
Married-couple Households Comparison
Aleuts
Vietnamese
45.6%
MARRIED-COUPLE HOUSEHOLDS
12.5/ 100
METRIC RATING
204th/ 347
METRIC RANK
43.6%
MARRIED-COUPLE HOUSEHOLDS
0.2/ 100
METRIC RATING
262nd/ 347
METRIC RANK
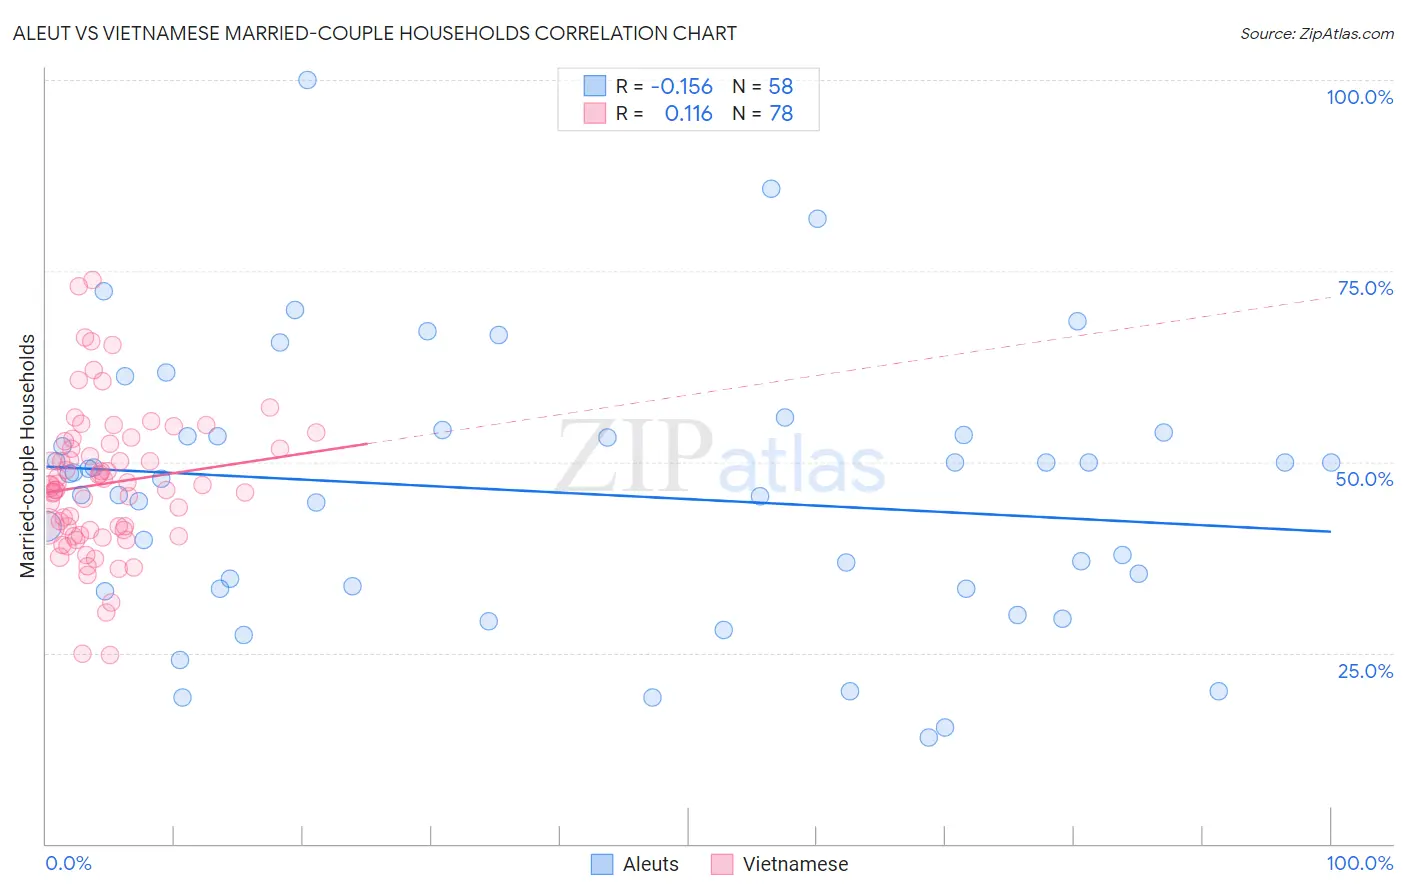
Aleut vs Vietnamese Married-couple Households Correlation Chart
The statistical analysis conducted on geographies consisting of 61,773,976 people shows a poor negative correlation between the proportion of Aleuts and percentage of married-couple family households in the United States with a correlation coefficient (R) of -0.156 and weighted average of 45.6%. Similarly, the statistical analysis conducted on geographies consisting of 170,654,128 people shows a poor positive correlation between the proportion of Vietnamese and percentage of married-couple family households in the United States with a correlation coefficient (R) of 0.116 and weighted average of 43.6%, a difference of 4.5%.
Married-couple Households Correlation Summary
| Measurement | Aleut | Vietnamese |
| Minimum | 14.0% | 24.7% |
| Maximum | 100.0% | 73.8% |
| Range | 86.0% | 49.1% |
| Mean | 46.1% | 47.2% |
| Median | 48.2% | 46.9% |
| Interquartile 25% (IQ1) | 33.3% | 41.0% |
| Interquartile 75% (IQ3) | 53.6% | 52.4% |
| Interquartile Range (IQR) | 20.2% | 11.4% |
| Standard Deviation (Sample) | 17.7% | 9.4% |
| Standard Deviation (Population) | 17.5% | 9.3% |
Similar Demographics by Married-couple Households
Demographics Similar to Aleuts by Married-couple Households
In terms of married-couple households, the demographic groups most similar to Aleuts are Alaska Native (45.6%, a difference of 0.050%), Nepalese (45.6%, a difference of 0.050%), Immigrants from Central America (45.7%, a difference of 0.14%), Uruguayan (45.5%, a difference of 0.20%), and Immigrants from Serbia (45.7%, a difference of 0.22%).
| Demographics | Rating | Rank | Married-couple Households |
| Cambodians | 21.3 /100 | #197 | Fair 45.9% |
| Ottawa | 19.4 /100 | #198 | Poor 45.8% |
| Carpatho Rusyns | 15.7 /100 | #199 | Poor 45.7% |
| Potawatomi | 15.6 /100 | #200 | Poor 45.7% |
| Immigrants | Serbia | 15.2 /100 | #201 | Poor 45.7% |
| Immigrants | Central America | 14.2 /100 | #202 | Poor 45.7% |
| Alaska Natives | 13.0 /100 | #203 | Poor 45.6% |
| Aleuts | 12.5 /100 | #204 | Poor 45.6% |
| Nepalese | 11.9 /100 | #205 | Poor 45.6% |
| Uruguayans | 10.4 /100 | #206 | Poor 45.5% |
| Immigrants | France | 8.8 /100 | #207 | Tragic 45.4% |
| Hispanics or Latinos | 8.7 /100 | #208 | Tragic 45.4% |
| Immigrants | Uzbekistan | 8.4 /100 | #209 | Tragic 45.4% |
| Cubans | 7.7 /100 | #210 | Tragic 45.4% |
| Immigrants | Spain | 7.3 /100 | #211 | Tragic 45.3% |
Demographics Similar to Vietnamese by Married-couple Households
In terms of married-couple households, the demographic groups most similar to Vietnamese are Alaskan Athabascan (43.6%, a difference of 0.060%), Cree (43.6%, a difference of 0.11%), Immigrants from Cameroon (43.7%, a difference of 0.19%), Bangladeshi (43.5%, a difference of 0.22%), and Iroquois (43.7%, a difference of 0.28%).
| Demographics | Rating | Rank | Married-couple Households |
| Shoshone | 0.3 /100 | #255 | Tragic 43.9% |
| Ugandans | 0.3 /100 | #256 | Tragic 43.8% |
| Blackfeet | 0.2 /100 | #257 | Tragic 43.8% |
| Central American Indians | 0.2 /100 | #258 | Tragic 43.8% |
| Iroquois | 0.2 /100 | #259 | Tragic 43.7% |
| Immigrants | Cameroon | 0.2 /100 | #260 | Tragic 43.7% |
| Alaskan Athabascans | 0.2 /100 | #261 | Tragic 43.6% |
| Vietnamese | 0.2 /100 | #262 | Tragic 43.6% |
| Cree | 0.1 /100 | #263 | Tragic 43.6% |
| Bangladeshis | 0.1 /100 | #264 | Tragic 43.5% |
| Moroccans | 0.1 /100 | #265 | Tragic 43.5% |
| Ecuadorians | 0.1 /100 | #266 | Tragic 43.5% |
| Natives/Alaskans | 0.1 /100 | #267 | Tragic 43.5% |
| Immigrants | Burma/Myanmar | 0.1 /100 | #268 | Tragic 43.4% |
| Immigrants | Sierra Leone | 0.1 /100 | #269 | Tragic 43.3% |