Alaskan Athabascan vs Korean Married-couple Households
COMPARE
Alaskan Athabascan
Korean
Married-couple Households
Married-couple Households Comparison
Alaskan Athabascans
Koreans
43.6%
MARRIED-COUPLE HOUSEHOLDS
0.2/ 100
METRIC RATING
261st/ 347
METRIC RANK
49.7%
MARRIED-COUPLE HOUSEHOLDS
99.9/ 100
METRIC RATING
15th/ 347
METRIC RANK
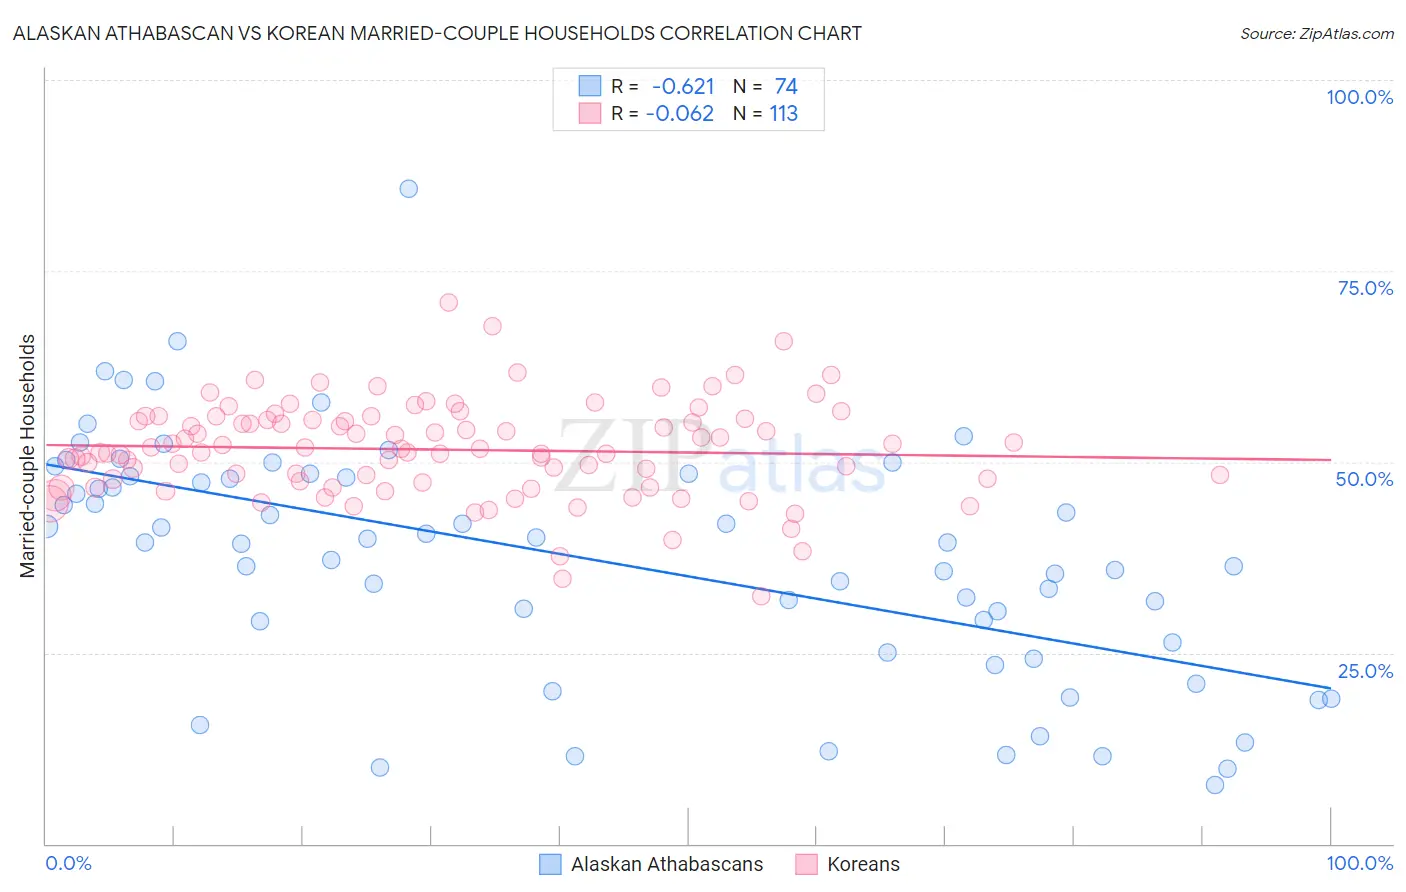
Alaskan Athabascan vs Korean Married-couple Households Correlation Chart
The statistical analysis conducted on geographies consisting of 45,814,810 people shows a significant negative correlation between the proportion of Alaskan Athabascans and percentage of married-couple family households in the United States with a correlation coefficient (R) of -0.621 and weighted average of 43.6%. Similarly, the statistical analysis conducted on geographies consisting of 510,373,209 people shows a slight negative correlation between the proportion of Koreans and percentage of married-couple family households in the United States with a correlation coefficient (R) of -0.062 and weighted average of 49.7%, a difference of 13.9%.
Married-couple Households Correlation Summary
| Measurement | Alaskan Athabascan | Korean |
| Minimum | 7.7% | 32.4% |
| Maximum | 85.7% | 70.8% |
| Range | 78.0% | 38.4% |
| Mean | 37.3% | 51.6% |
| Median | 39.4% | 51.7% |
| Interquartile 25% (IQ1) | 26.4% | 47.4% |
| Interquartile 75% (IQ3) | 48.1% | 55.6% |
| Interquartile Range (IQR) | 21.7% | 8.2% |
| Standard Deviation (Sample) | 15.6% | 6.3% |
| Standard Deviation (Population) | 15.5% | 6.3% |
Similar Demographics by Married-couple Households
Demographics Similar to Alaskan Athabascans by Married-couple Households
In terms of married-couple households, the demographic groups most similar to Alaskan Athabascans are Vietnamese (43.6%, a difference of 0.060%), Immigrants from Cameroon (43.7%, a difference of 0.13%), Cree (43.6%, a difference of 0.17%), Iroquois (43.7%, a difference of 0.22%), and Central American Indian (43.8%, a difference of 0.25%).
| Demographics | Rating | Rank | Married-couple Households |
| Apache | 0.3 /100 | #254 | Tragic 43.9% |
| Shoshone | 0.3 /100 | #255 | Tragic 43.9% |
| Ugandans | 0.3 /100 | #256 | Tragic 43.8% |
| Blackfeet | 0.2 /100 | #257 | Tragic 43.8% |
| Central American Indians | 0.2 /100 | #258 | Tragic 43.8% |
| Iroquois | 0.2 /100 | #259 | Tragic 43.7% |
| Immigrants | Cameroon | 0.2 /100 | #260 | Tragic 43.7% |
| Alaskan Athabascans | 0.2 /100 | #261 | Tragic 43.6% |
| Vietnamese | 0.2 /100 | #262 | Tragic 43.6% |
| Cree | 0.1 /100 | #263 | Tragic 43.6% |
| Bangladeshis | 0.1 /100 | #264 | Tragic 43.5% |
| Moroccans | 0.1 /100 | #265 | Tragic 43.5% |
| Ecuadorians | 0.1 /100 | #266 | Tragic 43.5% |
| Natives/Alaskans | 0.1 /100 | #267 | Tragic 43.5% |
| Immigrants | Burma/Myanmar | 0.1 /100 | #268 | Tragic 43.4% |
Demographics Similar to Koreans by Married-couple Households
In terms of married-couple households, the demographic groups most similar to Koreans are Swedish (49.7%, a difference of 0.030%), Burmese (49.8%, a difference of 0.14%), Immigrants from Hong Kong (49.6%, a difference of 0.18%), English (49.6%, a difference of 0.19%), and Immigrants from Korea (49.9%, a difference of 0.27%).
| Demographics | Rating | Rank | Married-couple Households |
| Immigrants | South Central Asia | 100.0 /100 | #8 | Exceptional 50.6% |
| Pennsylvania Germans | 100.0 /100 | #9 | Exceptional 50.4% |
| Chinese | 100.0 /100 | #10 | Exceptional 50.4% |
| Immigrants | Pakistan | 100.0 /100 | #11 | Exceptional 50.1% |
| Swiss | 100.0 /100 | #12 | Exceptional 49.9% |
| Immigrants | Korea | 100.0 /100 | #13 | Exceptional 49.9% |
| Burmese | 100.0 /100 | #14 | Exceptional 49.8% |
| Koreans | 99.9 /100 | #15 | Exceptional 49.7% |
| Swedes | 99.9 /100 | #16 | Exceptional 49.7% |
| Immigrants | Hong Kong | 99.9 /100 | #17 | Exceptional 49.6% |
| English | 99.9 /100 | #18 | Exceptional 49.6% |
| Europeans | 99.9 /100 | #19 | Exceptional 49.6% |
| Scandinavians | 99.9 /100 | #20 | Exceptional 49.6% |
| Norwegians | 99.9 /100 | #21 | Exceptional 49.5% |
| Asians | 99.9 /100 | #22 | Exceptional 49.5% |