Afghan vs Panamanian Divorced or Separated

COMPARE

Afghan
Race
Ancestry
AfghanAfricanAlaska NativeAlaskan AthabascanAlbanianAleutAlsatianAmericanApacheArabArapahoArgentineanArmenianAssyrian/Chaldean/SyriacAustralianAustrianBahamianBangladeshiBarbadianBasqueBelgianBelizeanBermudanBhutaneseBlackfeetBolivianBrazilianBritishBritish West IndianBulgarianBurmeseCajunCambodianCanadianCape VerdeanCarpatho RusynCelticCentral AmericanCentral American IndianCherokeeCheyenneChickasawChileanChineseChippewaChoctawColombianColvilleComancheCosta RicanCreeCreekCroatianCrowCubanCypriotCzechCzechoslovakianDanishDelawareDominicanDutchDutch West IndianEastern EuropeanEcuadorianEgyptianEnglishEstonianEthiopianEuropeanFijianFilipinoFinnishFrenchFrench American IndianFrench CanadianGermanGerman RussianGhanaianGreekGuamanian/ChamorroGuatemalanGuyaneseHaitianHmongHonduranHopiHoumaHungarianIcelanderIndian (Asian)IndonesianInupiatIranianIraqiIrishIroquoisIsraeliItalianJamaicanJapaneseJordanianKenyanKiowaKoreanLaotianLatvianLebaneseLiberianLithuanianLumbeeLuxembourgerMacedonianMalaysianMalteseMarshalleseMenomineeMexicanMexican American IndianMongolianMoroccanNative HawaiianNavajoNepaleseNew ZealanderNicaraguanNigerianNorthern EuropeanNorwegianOkinawanOsageOttawaPaiutePakistaniPalestinianParaguayanPennsylvania GermanPeruvianPimaPolishPortuguesePotawatomiPuebloPuerto RicanPuget Sound SalishRomanianRussianSalvadoranSamoanScandinavianScotch-IrishScottishSeminoleSenegaleseSerbianShoshoneSierra LeoneanSiouxSlavicSlovakSloveneSomaliSouth AfricanSouth AmericanSouth American IndianSoviet UnionSpaniardSpanishSpanish AmericanSpanish American IndianSri LankanSubsaharan AfricanSudaneseSwedishSwissSyrianTaiwaneseThaiTlingit-HaidaTohono O'OdhamTonganTrinidadian and TobagonianTsimshianTurkishU.S. Virgin IslanderUgandanUkrainianUruguayanUteVenezuelanVietnameseWelshWest IndianYakamaYaquiYugoslavianYumanYup'ikZimbabwean
Immigration
NonimmigrantsImmigrantsAfghanistanAfricaAlbaniaArgentinaArmeniaAsiaAustraliaAustriaBahamasBangladeshBarbadosBelarusBelgiumBelizeBoliviaBosnia and HerzegovinaBrazilBulgariaBurma/MyanmarCabo VerdeCambodiaCameroonCanadaCaribbeanCentral AmericaChileChinaColombiaCongoCosta RicaCroatiaCubaCzechoslovakiaDenmarkDominicaDominican RepublicEastern AfricaEastern AsiaEastern EuropeEcuadorEgyptEl SalvadorEnglandEritreaEthiopiaEuropeFijiFranceGermanyGhanaGreeceGrenadaGuatemalaGuyanaHaitiHondurasHong KongHungaryIndiaIndonesiaIranIraqIrelandIsraelItalyJamaicaJapanJordanKazakhstanKenyaKoreaKuwaitLaosLatin AmericaLatviaLebanonLiberiaLithuaniaMalaysiaMexicoMicronesiaMiddle AfricaMoldovaMoroccoNepalNetherlandsNicaraguaNigeriaNorth AmericaNorth MacedoniaNorthern AfricaNorthern EuropeNorwayOceaniaPakistanPanamaPeruPhilippinesPolandPortugalRomaniaRussiaSaudi ArabiaScotlandSenegalSerbiaSierra LeoneSingaporeSomaliaSouth AfricaSouth AmericaSouth Central AsiaSouth Eastern AsiaSouthern EuropeSpainSri LankaSt. Vincent and the GrenadinesSudanSwedenSwitzerlandSyriaTaiwanThailandTrinidad and TobagoTurkeyUgandaUkraineUruguayUzbekistanVenezuelaVietnamWest IndiesWestern AfricaWestern AsiaWestern EuropeYemenZaireZimbabweAzores
Panamanian
Race
Ancestry
AfricanAlaska NativeAlaskan AthabascanAlbanianAleutAlsatianAmericanApacheArabArapahoArgentineanArmenianAssyrian/Chaldean/SyriacAustralianAustrianBahamianBangladeshiBarbadianBasqueBelgianBelizeanBermudanBhutaneseBlackfeetBolivianBrazilianBritishBritish West IndianBulgarianBurmeseCajunCambodianCanadianCape VerdeanCarpatho RusynCelticCentral AmericanCentral American IndianCherokeeCheyenneChickasawChileanChineseChippewaChoctawColombianColvilleComancheCosta RicanCreeCreekCroatianCrowCubanCypriotCzechCzechoslovakianDanishDelawareDominicanDutchDutch West IndianEastern EuropeanEcuadorianEgyptianEnglishEstonianEthiopianEuropeanFijianFilipinoFinnishFrenchFrench American IndianFrench CanadianGermanGerman RussianGhanaianGreekGuamanian/ChamorroGuatemalanGuyaneseHaitianHmongHonduranHopiHoumaHungarianIcelanderIndian (Asian)IndonesianInupiatIranianIraqiIrishIroquoisIsraeliItalianJamaicanJapaneseJordanianKenyanKiowaKoreanLaotianLatvianLebaneseLiberianLithuanianLumbeeLuxembourgerMacedonianMalaysianMalteseMarshalleseMenomineeMexicanMexican American IndianMongolianMoroccanNative HawaiianNavajoNepaleseNew ZealanderNicaraguanNigerianNorthern EuropeanNorwegianOkinawanOsageOttawaPaiutePakistaniPalestinianPanamanianParaguayanPennsylvania GermanPeruvianPimaPolishPortuguesePotawatomiPuebloPuerto RicanPuget Sound SalishRomanianRussianSalvadoranSamoanScandinavianScotch-IrishScottishSeminoleSenegaleseSerbianShoshoneSierra LeoneanSiouxSlavicSlovakSloveneSomaliSouth AfricanSouth AmericanSouth American IndianSoviet UnionSpaniardSpanishSpanish AmericanSpanish American IndianSri LankanSubsaharan AfricanSudaneseSwedishSwissSyrianTaiwaneseThaiTlingit-HaidaTohono O'OdhamTonganTrinidadian and TobagonianTsimshianTurkishU.S. Virgin IslanderUgandanUkrainianUruguayanUteVenezuelanVietnameseWelshWest IndianYakamaYaquiYugoslavianYumanYup'ikZimbabwean
Immigration
NonimmigrantsImmigrantsAfghanistanAfricaAlbaniaArgentinaArmeniaAsiaAustraliaAustriaBahamasBangladeshBarbadosBelarusBelgiumBelizeBoliviaBosnia and HerzegovinaBrazilBulgariaBurma/MyanmarCabo VerdeCambodiaCameroonCanadaCaribbeanCentral AmericaChileChinaColombiaCongoCosta RicaCroatiaCubaCzechoslovakiaDenmarkDominicaDominican RepublicEastern AfricaEastern AsiaEastern EuropeEcuadorEgyptEl SalvadorEnglandEritreaEthiopiaEuropeFijiFranceGermanyGhanaGreeceGrenadaGuatemalaGuyanaHaitiHondurasHong KongHungaryIndiaIndonesiaIranIraqIrelandIsraelItalyJamaicaJapanJordanKazakhstanKenyaKoreaKuwaitLaosLatin AmericaLatviaLebanonLiberiaLithuaniaMalaysiaMexicoMicronesiaMiddle AfricaMoldovaMoroccoNepalNetherlandsNicaraguaNigeriaNorth AmericaNorth MacedoniaNorthern AfricaNorthern EuropeNorwayOceaniaPakistanPanamaPeruPhilippinesPolandPortugalRomaniaRussiaSaudi ArabiaScotlandSenegalSerbiaSierra LeoneSingaporeSomaliaSouth AfricaSouth AmericaSouth Central AsiaSouth Eastern AsiaSouthern EuropeSpainSri LankaSt. Vincent and the GrenadinesSudanSwedenSwitzerlandSyriaTaiwanThailandTrinidad and TobagoTurkeyUgandaUkraineUruguayUzbekistanVenezuelaVietnamWest IndiesWestern AfricaWestern AsiaWestern EuropeYemenZaireZimbabweAzores
Divorced or Separated
Income
Poverty
Unemployment
Labor Participation
Family Structure
Vehicle Availability
Education Level
Disability

Divorced or Separated Comparison

Afghans

Panamanians

Exceptional
Tragic
11.5%
DIVORCED OR SEPARATED
99.4/ 100
METRIC RATING
78th/ 347
METRIC RANK
12.7%
DIVORCED OR SEPARATED
0.3/ 100
METRIC RATING
271st/ 347
METRIC RANK

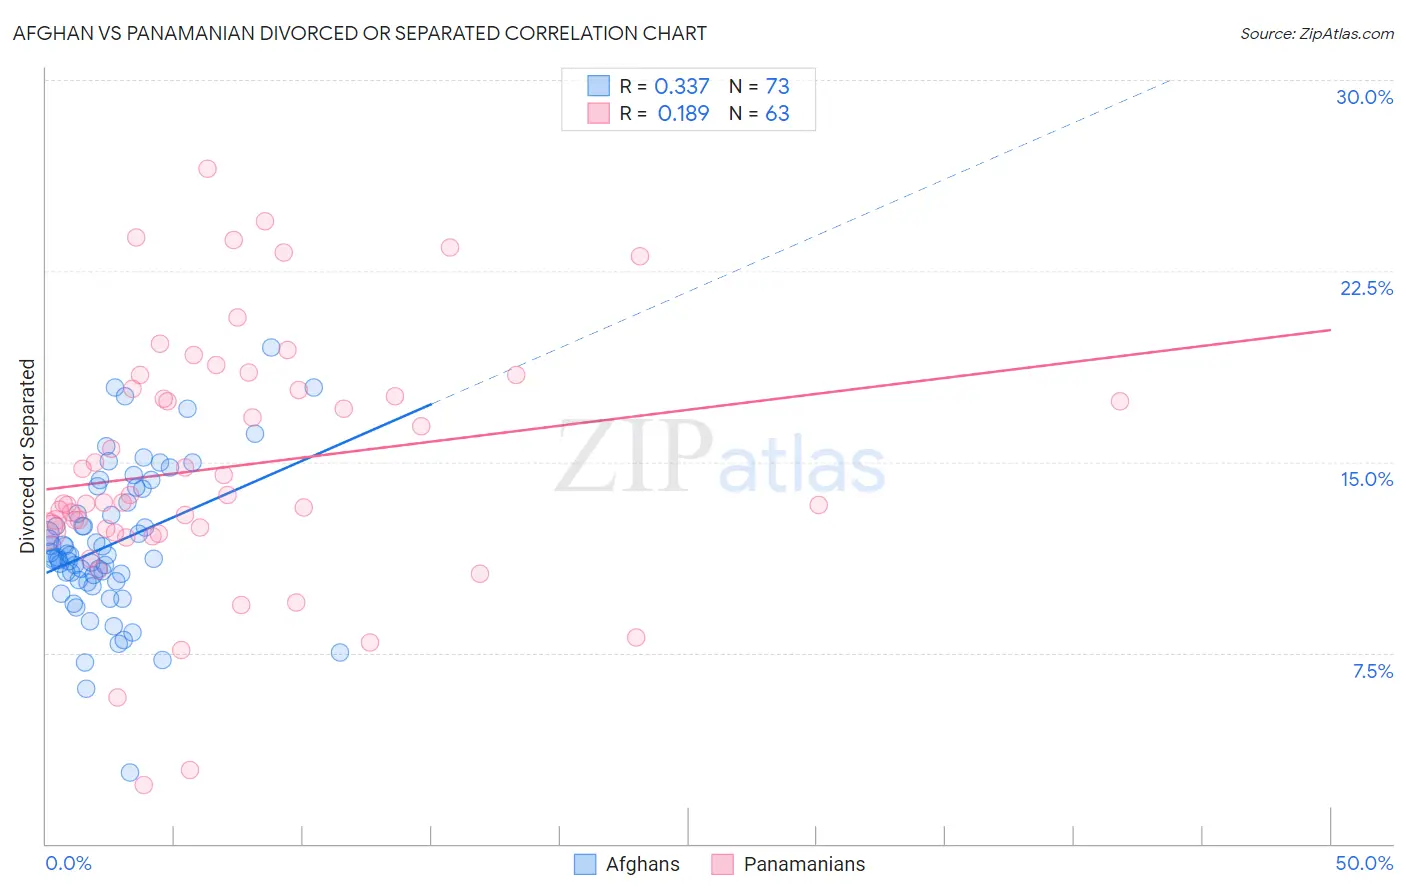
Afghan vs Panamanian Divorced or Separated Correlation Chart

The statistical analysis conducted on geographies consisting of 148,858,347 people shows a mild positive correlation between the proportion of Afghans and percentage of population currently divorced or separated in the United States with a correlation coefficient (R) of 0.337 and weighted average of 11.5%. Similarly, the statistical analysis conducted on geographies consisting of 281,170,767 people shows a poor positive correlation between the proportion of Panamanians and percentage of population currently divorced or separated in the United States with a correlation coefficient (R) of 0.189 and weighted average of 12.7%, a difference of 9.9%.
Afghan vs Panamanian Divorced or Separated

Divorced or Separated Correlation Summary

MeasurementAfghanPanamanian
Minimum2.8%2.3%
Maximum19.5%26.5%
Range16.7%24.2%
Mean11.8%14.8%
Median11.4%13.4%
Interquartile 25% (IQ1)10.3%12.3%
Interquartile 75% (IQ3)13.7%17.9%
Interquartile Range (IQR)3.3%5.6%
Standard Deviation (Sample)2.9%5.0%
Standard Deviation (Population)2.9%4.9%

Similar Demographics by Divorced or Separated

Demographics Similar to Afghans by Divorced or Separated

In terms of divorced or separated, the demographic groups most similar to Afghans are Guyanese (11.5%, a difference of 0.040%), Immigrants from Switzerland (11.5%, a difference of 0.060%), Russian (11.5%, a difference of 0.070%), Immigrants from Italy (11.5%, a difference of 0.10%), and Immigrants from Romania (11.5%, a difference of 0.15%).
DemographicsRating | RankDivorced or Separated
Paraguayans
99.7
/100
|
#71
Exceptional
11.5%
Jordanians
99.6
/100
|
#72
Exceptional
11.5%
Immigrants | North Macedonia
99.6
/100
|
#73
Exceptional
11.5%
Taiwanese
99.6
/100
|
#74
Exceptional
11.5%
Immigrants | Northern Africa
99.6
/100
|
#75
Exceptional
11.5%
Albanians
99.6
/100
|
#76
Exceptional
11.5%
Immigrants | Italy
99.5
/100
|
#77
Exceptional
11.5%
Afghans
99.4
/100
|
#78
Exceptional
11.5%
Guyanese
99.4
/100
|
#79
Exceptional
11.5%
Immigrants | Switzerland
99.4
/100
|
#80
Exceptional
11.5%
Russians
99.4
/100
|
#81
Exceptional
11.5%
Immigrants | Romania
99.3
/100
|
#82
Exceptional
11.5%
Immigrants | Bulgaria
99.3
/100
|
#83
Exceptional
11.5%
Bulgarians
99.3
/100
|
#84
Exceptional
11.5%
Immigrants | Albania
99.3
/100
|
#85
Exceptional
11.5%

Demographics Similar to Panamanians by Divorced or Separated

In terms of divorced or separated, the demographic groups most similar to Panamanians are Immigrants from Middle Africa (12.7%, a difference of 0.050%), Ute (12.6%, a difference of 0.060%), Immigrants from Micronesia (12.7%, a difference of 0.16%), Immigrants from Liberia (12.6%, a difference of 0.18%), and Bermudan (12.7%, a difference of 0.18%).
DemographicsRating | RankDivorced or Separated
English
0.5
/100
|
#264
Tragic
12.6%
Immigrants | Senegal
0.5
/100
|
#265
Tragic
12.6%
Whites/Caucasians
0.5
/100
|
#266
Tragic
12.6%
Scottish
0.4
/100
|
#267
Tragic
12.6%
Fijians
0.4
/100
|
#268
Tragic
12.6%
Immigrants | Liberia
0.4
/100
|
#269
Tragic
12.6%
Ute
0.4
/100
|
#270
Tragic
12.6%
Panamanians
0.3
/100
|
#271
Tragic
12.7%
Immigrants | Middle Africa
0.3
/100
|
#272
Tragic
12.7%
Immigrants | Micronesia
0.3
/100
|
#273
Tragic
12.7%
Bermudans
0.3
/100
|
#274
Tragic
12.7%
Central American Indians
0.3
/100
|
#275
Tragic
12.7%
Spaniards
0.2
/100
|
#276
Tragic
12.7%
Dominicans
0.2
/100
|
#277
Tragic
12.7%
Lumbee
0.2
/100
|
#278
Tragic
12.7%