Lebanese vs French American Indian Master's Degree
COMPARE
Lebanese
French American Indian
Master's Degree
Master's Degree Comparison
Lebanese
French American Indians
16.5%
MASTER'S DEGREE
96.4/ 100
METRIC RATING
120th/ 347
METRIC RANK
12.7%
MASTER'S DEGREE
1.0/ 100
METRIC RATING
252nd/ 347
METRIC RANK
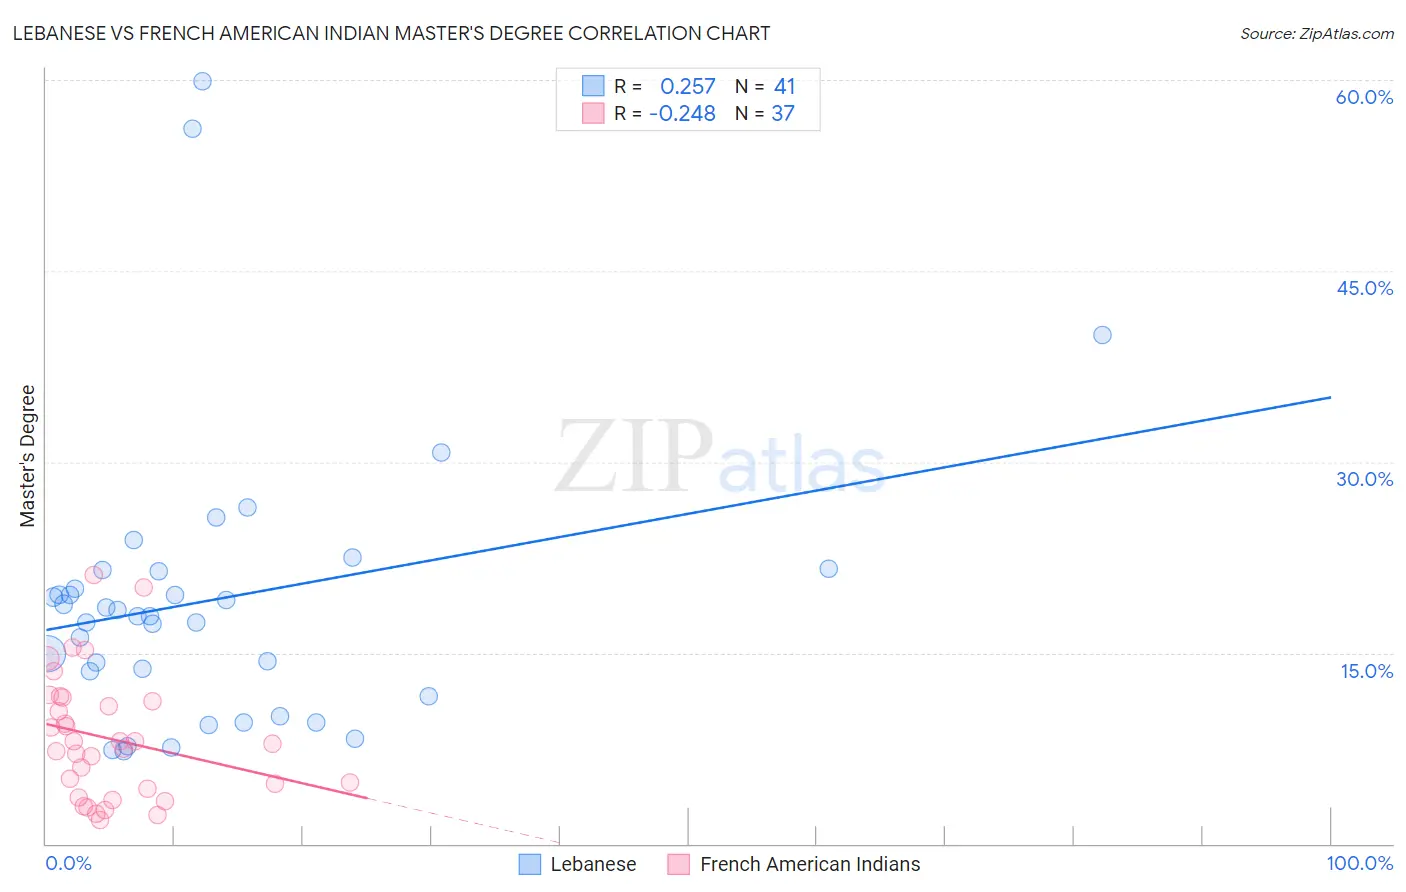
Lebanese vs French American Indian Master's Degree Correlation Chart
The statistical analysis conducted on geographies consisting of 401,481,649 people shows a weak positive correlation between the proportion of Lebanese and percentage of population with at least master's degree education in the United States with a correlation coefficient (R) of 0.257 and weighted average of 16.5%. Similarly, the statistical analysis conducted on geographies consisting of 131,966,823 people shows a weak negative correlation between the proportion of French American Indians and percentage of population with at least master's degree education in the United States with a correlation coefficient (R) of -0.248 and weighted average of 12.7%, a difference of 29.7%.
Master's Degree Correlation Summary
| Measurement | Lebanese | French American Indian |
| Minimum | 7.3% | 1.9% |
| Maximum | 60.0% | 21.1% |
| Range | 52.6% | 19.2% |
| Mean | 19.2% | 8.3% |
| Median | 17.9% | 7.9% |
| Interquartile 25% (IQ1) | 12.6% | 4.0% |
| Interquartile 75% (IQ3) | 21.4% | 11.4% |
| Interquartile Range (IQR) | 8.9% | 7.4% |
| Standard Deviation (Sample) | 11.2% | 4.9% |
| Standard Deviation (Population) | 11.0% | 4.8% |
Similar Demographics by Master's Degree
Demographics Similar to Lebanese by Master's Degree
In terms of master's degree, the demographic groups most similar to Lebanese are Jordanian (16.5%, a difference of 0.10%), Afghan (16.5%, a difference of 0.20%), Brazilian (16.5%, a difference of 0.33%), British (16.4%, a difference of 0.63%), and Croatian (16.4%, a difference of 0.64%).
| Demographics | Rating | Rank | Master's Degree |
| Arabs | 97.7 /100 | #113 | Exceptional 16.7% |
| Northern Europeans | 97.6 /100 | #114 | Exceptional 16.7% |
| Immigrants | Uganda | 97.3 /100 | #115 | Exceptional 16.6% |
| Immigrants | Southern Europe | 97.2 /100 | #116 | Exceptional 16.6% |
| Immigrants | Moldova | 97.2 /100 | #117 | Exceptional 16.6% |
| Brazilians | 96.8 /100 | #118 | Exceptional 16.5% |
| Jordanians | 96.5 /100 | #119 | Exceptional 16.5% |
| Lebanese | 96.4 /100 | #120 | Exceptional 16.5% |
| Afghans | 96.2 /100 | #121 | Exceptional 16.5% |
| British | 95.6 /100 | #122 | Exceptional 16.4% |
| Croatians | 95.6 /100 | #123 | Exceptional 16.4% |
| Immigrants | Eritrea | 95.5 /100 | #124 | Exceptional 16.4% |
| Italians | 95.4 /100 | #125 | Exceptional 16.4% |
| Immigrants | Eastern Africa | 95.2 /100 | #126 | Exceptional 16.3% |
| Palestinians | 94.8 /100 | #127 | Exceptional 16.3% |
Demographics Similar to French American Indians by Master's Degree
In terms of master's degree, the demographic groups most similar to French American Indians are Immigrants from Dominica (12.6%, a difference of 0.54%), Indonesian (12.6%, a difference of 0.59%), Immigrants from Congo (12.6%, a difference of 0.61%), Immigrants from Portugal (12.6%, a difference of 0.69%), and Tlingit-Haida (12.8%, a difference of 0.98%).
| Demographics | Rating | Rank | Master's Degree |
| Immigrants | Bahamas | 1.4 /100 | #245 | Tragic 12.9% |
| Immigrants | Cambodia | 1.4 /100 | #246 | Tragic 12.9% |
| Iroquois | 1.4 /100 | #247 | Tragic 12.9% |
| Africans | 1.4 /100 | #248 | Tragic 12.9% |
| Cree | 1.3 /100 | #249 | Tragic 12.8% |
| Liberians | 1.3 /100 | #250 | Tragic 12.8% |
| Tlingit-Haida | 1.3 /100 | #251 | Tragic 12.8% |
| French American Indians | 1.0 /100 | #252 | Tragic 12.7% |
| Immigrants | Dominica | 0.8 /100 | #253 | Tragic 12.6% |
| Indonesians | 0.8 /100 | #254 | Tragic 12.6% |
| Immigrants | Congo | 0.8 /100 | #255 | Tragic 12.6% |
| Immigrants | Portugal | 0.8 /100 | #256 | Tragic 12.6% |
| Osage | 0.7 /100 | #257 | Tragic 12.6% |
| Immigrants | Liberia | 0.6 /100 | #258 | Tragic 12.5% |
| Japanese | 0.6 /100 | #259 | Tragic 12.5% |