Delaware vs Immigrants from Laos 5th Grade
COMPARE
Delaware
Immigrants from Laos
5th Grade
5th Grade Comparison
Delaware
Immigrants from Laos
97.8%
5TH GRADE
98.6/ 100
METRIC RATING
93rd/ 347
METRIC RANK
96.0%
5TH GRADE
0.0/ 100
METRIC RATING
305th/ 347
METRIC RANK
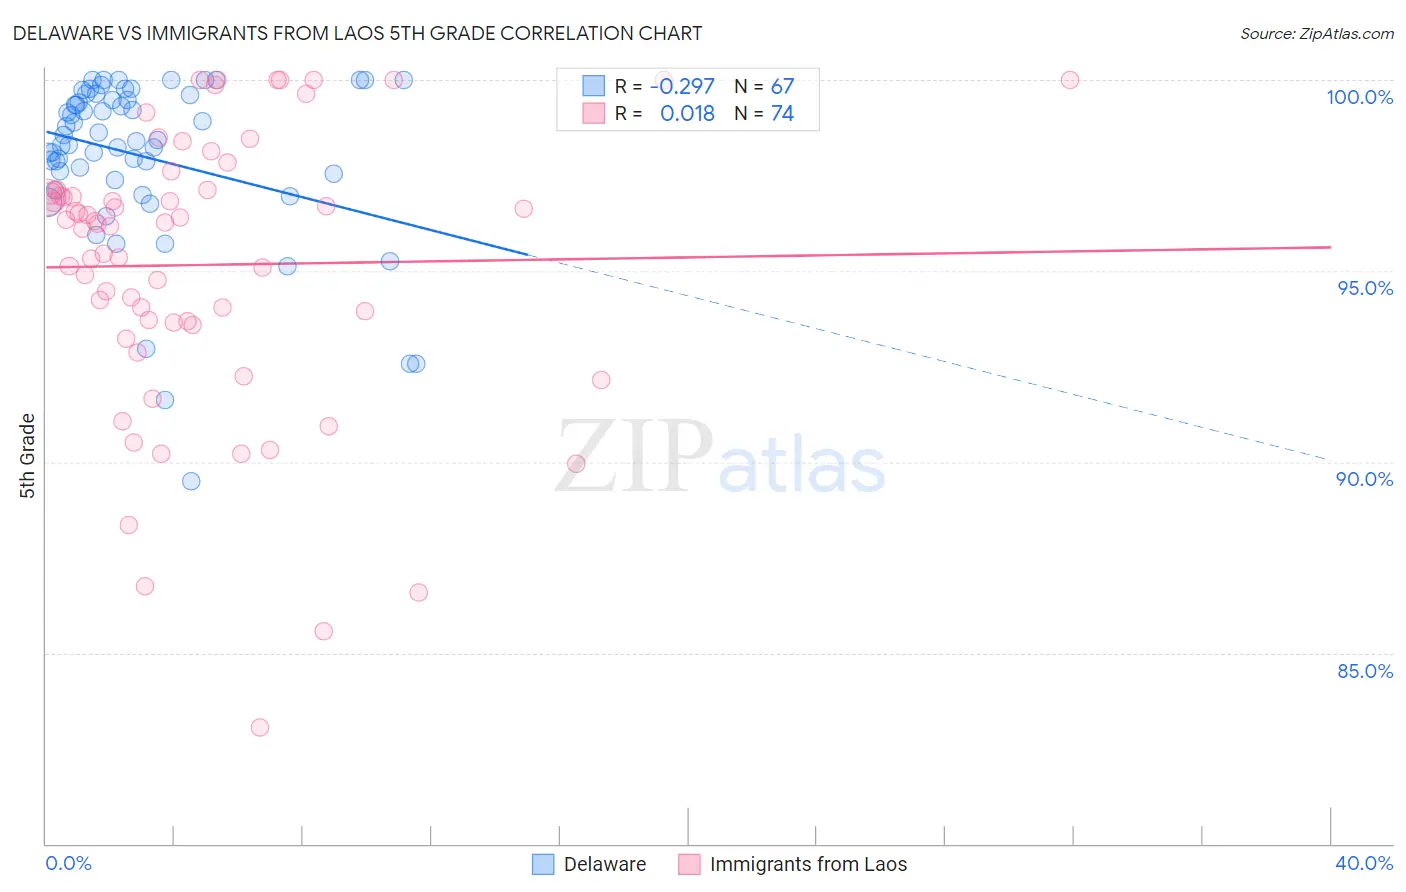
Delaware vs Immigrants from Laos 5th Grade Correlation Chart
The statistical analysis conducted on geographies consisting of 96,235,191 people shows a weak negative correlation between the proportion of Delaware and percentage of population with at least 5th grade education in the United States with a correlation coefficient (R) of -0.297 and weighted average of 97.8%. Similarly, the statistical analysis conducted on geographies consisting of 201,472,886 people shows no correlation between the proportion of Immigrants from Laos and percentage of population with at least 5th grade education in the United States with a correlation coefficient (R) of 0.018 and weighted average of 96.0%, a difference of 1.8%.
5th Grade Correlation Summary
| Measurement | Delaware | Immigrants from Laos |
| Minimum | 89.5% | 83.0% |
| Maximum | 100.0% | 100.0% |
| Range | 10.5% | 17.0% |
| Mean | 98.0% | 95.2% |
| Median | 98.4% | 96.3% |
| Interquartile 25% (IQ1) | 97.4% | 93.7% |
| Interquartile 75% (IQ3) | 99.6% | 97.1% |
| Interquartile Range (IQR) | 2.2% | 3.4% |
| Standard Deviation (Sample) | 2.2% | 3.7% |
| Standard Deviation (Population) | 2.2% | 3.7% |
Similar Demographics by 5th Grade
Demographics Similar to Delaware by 5th Grade
In terms of 5th grade, the demographic groups most similar to Delaware are Immigrants from Denmark (97.8%, a difference of 0.0%), Immigrants from South Africa (97.8%, a difference of 0.010%), Immigrants from Ireland (97.8%, a difference of 0.010%), Immigrants from Western Europe (97.8%, a difference of 0.010%), and Immigrants from Sweden (97.8%, a difference of 0.010%).
| Demographics | Rating | Rank | 5th Grade |
| Cypriots | 98.9 /100 | #86 | Exceptional 97.8% |
| Immigrants | Australia | 98.8 /100 | #87 | Exceptional 97.8% |
| Shoshone | 98.8 /100 | #88 | Exceptional 97.8% |
| Immigrants | South Africa | 98.8 /100 | #89 | Exceptional 97.8% |
| Immigrants | Ireland | 98.8 /100 | #90 | Exceptional 97.8% |
| Immigrants | Western Europe | 98.8 /100 | #91 | Exceptional 97.8% |
| Immigrants | Sweden | 98.7 /100 | #92 | Exceptional 97.8% |
| Delaware | 98.6 /100 | #93 | Exceptional 97.8% |
| Immigrants | Denmark | 98.6 /100 | #94 | Exceptional 97.8% |
| Romanians | 98.6 /100 | #95 | Exceptional 97.8% |
| Immigrants | Germany | 98.5 /100 | #96 | Exceptional 97.8% |
| Cree | 98.4 /100 | #97 | Exceptional 97.7% |
| Yugoslavians | 98.3 /100 | #98 | Exceptional 97.7% |
| Turks | 98.3 /100 | #99 | Exceptional 97.7% |
| Puget Sound Salish | 98.3 /100 | #100 | Exceptional 97.7% |
Demographics Similar to Immigrants from Laos by 5th Grade
In terms of 5th grade, the demographic groups most similar to Immigrants from Laos are Immigrants from Burma/Myanmar (96.1%, a difference of 0.010%), Immigrants from Haiti (96.0%, a difference of 0.010%), Immigrants from Caribbean (96.0%, a difference of 0.020%), Ecuadorian (96.0%, a difference of 0.030%), and Immigrants from Guyana (96.0%, a difference of 0.030%).
| Demographics | Rating | Rank | 5th Grade |
| Immigrants | Dominica | 0.0 /100 | #298 | Tragic 96.2% |
| Immigrants | Immigrants | 0.0 /100 | #299 | Tragic 96.2% |
| Sri Lankans | 0.0 /100 | #300 | Tragic 96.1% |
| Immigrants | Cuba | 0.0 /100 | #301 | Tragic 96.1% |
| Guyanese | 0.0 /100 | #302 | Tragic 96.1% |
| Puerto Ricans | 0.0 /100 | #303 | Tragic 96.1% |
| Immigrants | Burma/Myanmar | 0.0 /100 | #304 | Tragic 96.1% |
| Immigrants | Laos | 0.0 /100 | #305 | Tragic 96.0% |
| Immigrants | Haiti | 0.0 /100 | #306 | Tragic 96.0% |
| Immigrants | Caribbean | 0.0 /100 | #307 | Tragic 96.0% |
| Ecuadorians | 0.0 /100 | #308 | Tragic 96.0% |
| Immigrants | Guyana | 0.0 /100 | #309 | Tragic 96.0% |
| Indonesians | 0.0 /100 | #310 | Tragic 96.0% |
| Immigrants | Bangladesh | 0.0 /100 | #311 | Tragic 96.0% |
| Vietnamese | 0.0 /100 | #312 | Tragic 95.9% |