Venezuelan vs Immigrants from India Bachelor's Degree
COMPARE
Venezuelan
Immigrants from India
Bachelor's Degree
Bachelor's Degree Comparison
Venezuelans
Immigrants from India
40.5%
BACHELOR'S DEGREE
94.7/ 100
METRIC RATING
120th/ 347
METRIC RANK
51.3%
BACHELOR'S DEGREE
100.0/ 100
METRIC RATING
3rd/ 347
METRIC RANK
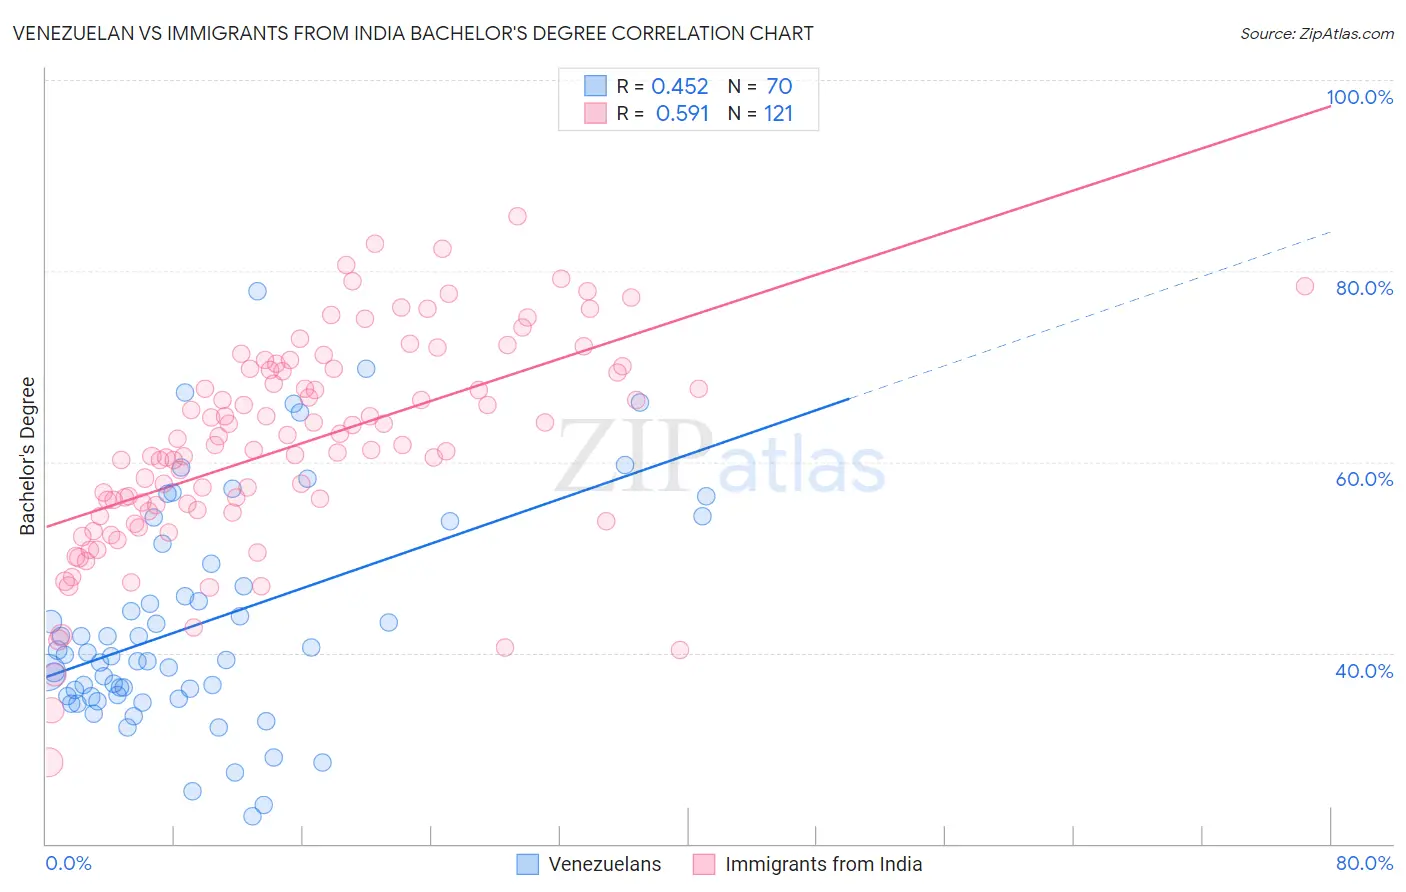
Venezuelan vs Immigrants from India Bachelor's Degree Correlation Chart
The statistical analysis conducted on geographies consisting of 306,305,141 people shows a moderate positive correlation between the proportion of Venezuelans and percentage of population with at least bachelor's degree education in the United States with a correlation coefficient (R) of 0.452 and weighted average of 40.5%. Similarly, the statistical analysis conducted on geographies consisting of 434,046,114 people shows a substantial positive correlation between the proportion of Immigrants from India and percentage of population with at least bachelor's degree education in the United States with a correlation coefficient (R) of 0.591 and weighted average of 51.3%, a difference of 26.7%.
Bachelor's Degree Correlation Summary
| Measurement | Venezuelan | Immigrants from India |
| Minimum | 22.9% | 28.5% |
| Maximum | 77.9% | 85.7% |
| Range | 55.1% | 57.2% |
| Mean | 43.1% | 61.6% |
| Median | 39.7% | 61.8% |
| Interquartile 25% (IQ1) | 35.5% | 54.8% |
| Interquartile 75% (IQ3) | 49.3% | 69.7% |
| Interquartile Range (IQR) | 13.8% | 14.9% |
| Standard Deviation (Sample) | 11.7% | 10.9% |
| Standard Deviation (Population) | 11.6% | 10.9% |
Similar Demographics by Bachelor's Degree
Demographics Similar to Venezuelans by Bachelor's Degree
In terms of bachelor's degree, the demographic groups most similar to Venezuelans are Moroccan (40.5%, a difference of 0.050%), Immigrants from Syria (40.5%, a difference of 0.070%), Immigrants from Albania (40.4%, a difference of 0.15%), Lebanese (40.4%, a difference of 0.17%), and Immigrants from Eritrea (40.4%, a difference of 0.17%).
| Demographics | Rating | Rank | Bachelor's Degree |
| Brazilians | 96.3 /100 | #113 | Exceptional 40.8% |
| Afghans | 96.2 /100 | #114 | Exceptional 40.8% |
| Palestinians | 95.8 /100 | #115 | Exceptional 40.7% |
| Immigrants | Uganda | 95.7 /100 | #116 | Exceptional 40.7% |
| Austrians | 95.5 /100 | #117 | Exceptional 40.6% |
| Croatians | 95.5 /100 | #118 | Exceptional 40.6% |
| Immigrants | Syria | 94.9 /100 | #119 | Exceptional 40.5% |
| Venezuelans | 94.7 /100 | #120 | Exceptional 40.5% |
| Moroccans | 94.6 /100 | #121 | Exceptional 40.5% |
| Immigrants | Albania | 94.4 /100 | #122 | Exceptional 40.4% |
| Lebanese | 94.3 /100 | #123 | Exceptional 40.4% |
| Immigrants | Eritrea | 94.3 /100 | #124 | Exceptional 40.4% |
| British | 94.2 /100 | #125 | Exceptional 40.4% |
| Immigrants | Eastern Africa | 94.1 /100 | #126 | Exceptional 40.4% |
| Immigrants | Jordan | 93.4 /100 | #127 | Exceptional 40.3% |
Demographics Similar to Immigrants from India by Bachelor's Degree
In terms of bachelor's degree, the demographic groups most similar to Immigrants from India are Immigrants from Taiwan (51.2%, a difference of 0.21%), Iranian (51.0%, a difference of 0.63%), Immigrants from Singapore (51.9%, a difference of 1.2%), Okinawan (50.5%, a difference of 1.5%), and Immigrants from Iran (50.3%, a difference of 2.0%).
| Demographics | Rating | Rank | Bachelor's Degree |
| Filipinos | 100.0 /100 | #1 | Exceptional 52.7% |
| Immigrants | Singapore | 100.0 /100 | #2 | Exceptional 51.9% |
| Immigrants | India | 100.0 /100 | #3 | Exceptional 51.3% |
| Immigrants | Taiwan | 100.0 /100 | #4 | Exceptional 51.2% |
| Iranians | 100.0 /100 | #5 | Exceptional 51.0% |
| Okinawans | 100.0 /100 | #6 | Exceptional 50.5% |
| Immigrants | Iran | 100.0 /100 | #7 | Exceptional 50.3% |
| Thais | 100.0 /100 | #8 | Exceptional 50.1% |
| Immigrants | Israel | 100.0 /100 | #9 | Exceptional 50.0% |
| Cypriots | 100.0 /100 | #10 | Exceptional 49.0% |
| Immigrants | Australia | 100.0 /100 | #11 | Exceptional 48.5% |
| Immigrants | China | 100.0 /100 | #12 | Exceptional 48.4% |
| Immigrants | South Central Asia | 100.0 /100 | #13 | Exceptional 48.3% |
| Immigrants | Hong Kong | 100.0 /100 | #14 | Exceptional 48.2% |
| Immigrants | Eastern Asia | 100.0 /100 | #15 | Exceptional 48.1% |