Venezuelan vs Immigrants from Bulgaria Bachelor's Degree
COMPARE
Venezuelan
Immigrants from Bulgaria
Bachelor's Degree
Bachelor's Degree Comparison
Venezuelans
Immigrants from Bulgaria
40.5%
BACHELOR'S DEGREE
94.7/ 100
METRIC RATING
120th/ 347
METRIC RANK
44.6%
BACHELOR'S DEGREE
99.9/ 100
METRIC RATING
46th/ 347
METRIC RANK
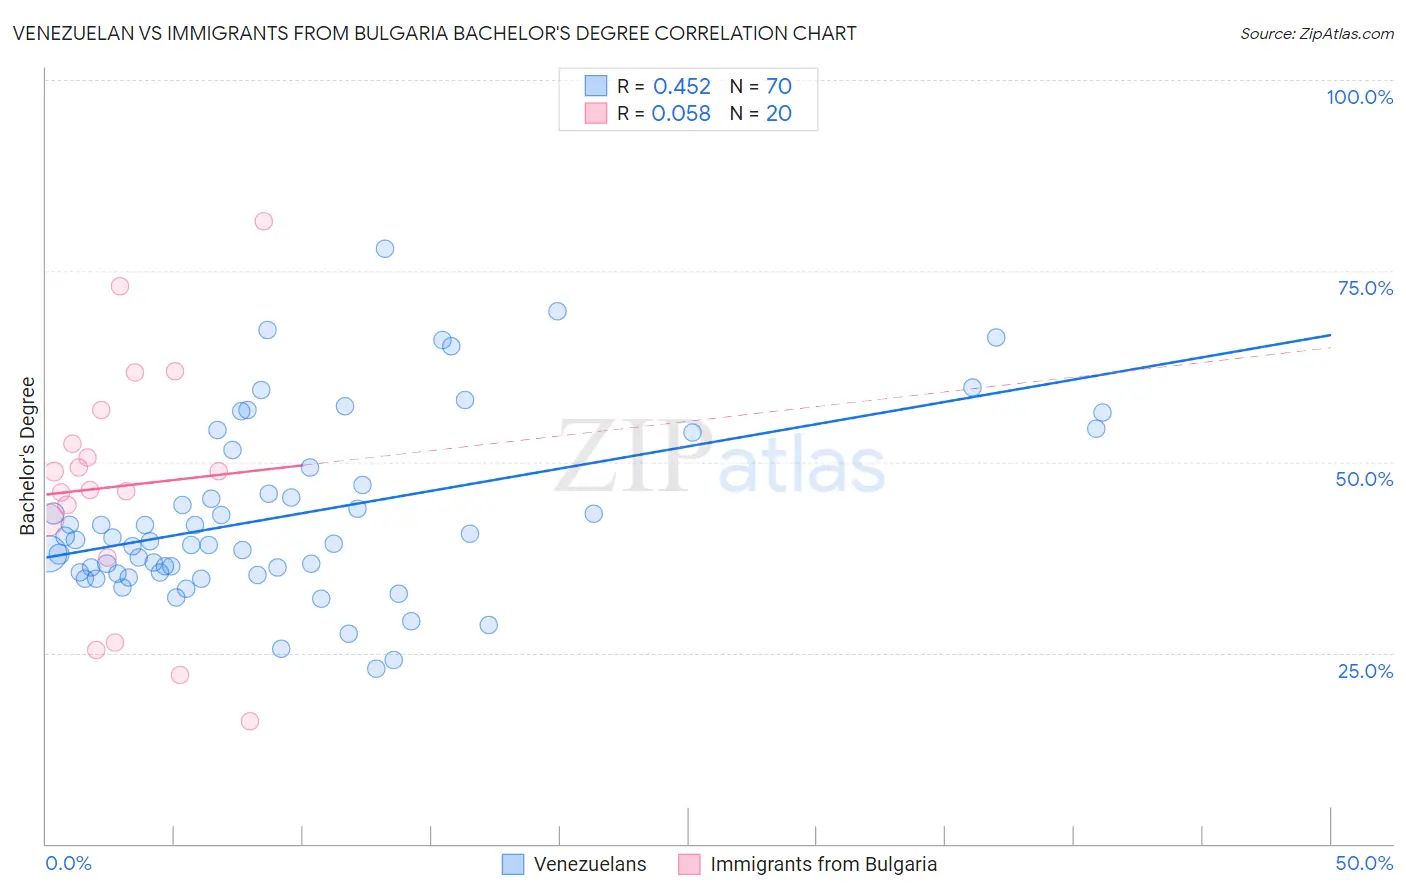
Venezuelan vs Immigrants from Bulgaria Bachelor's Degree Correlation Chart
The statistical analysis conducted on geographies consisting of 306,305,141 people shows a moderate positive correlation between the proportion of Venezuelans and percentage of population with at least bachelor's degree education in the United States with a correlation coefficient (R) of 0.452 and weighted average of 40.5%. Similarly, the statistical analysis conducted on geographies consisting of 172,546,854 people shows a slight positive correlation between the proportion of Immigrants from Bulgaria and percentage of population with at least bachelor's degree education in the United States with a correlation coefficient (R) of 0.058 and weighted average of 44.6%, a difference of 10.1%.
Bachelor's Degree Correlation Summary
| Measurement | Venezuelan | Immigrants from Bulgaria |
| Minimum | 22.9% | 16.1% |
| Maximum | 77.9% | 81.6% |
| Range | 55.1% | 65.5% |
| Mean | 43.1% | 46.9% |
| Median | 39.7% | 47.6% |
| Interquartile 25% (IQ1) | 35.5% | 39.9% |
| Interquartile 75% (IQ3) | 49.3% | 54.5% |
| Interquartile Range (IQR) | 13.8% | 14.6% |
| Standard Deviation (Sample) | 11.7% | 16.3% |
| Standard Deviation (Population) | 11.6% | 15.9% |
Similar Demographics by Bachelor's Degree
Demographics Similar to Venezuelans by Bachelor's Degree
In terms of bachelor's degree, the demographic groups most similar to Venezuelans are Moroccan (40.5%, a difference of 0.050%), Immigrants from Syria (40.5%, a difference of 0.070%), Immigrants from Albania (40.4%, a difference of 0.15%), Lebanese (40.4%, a difference of 0.17%), and Immigrants from Eritrea (40.4%, a difference of 0.17%).
| Demographics | Rating | Rank | Bachelor's Degree |
| Brazilians | 96.3 /100 | #113 | Exceptional 40.8% |
| Afghans | 96.2 /100 | #114 | Exceptional 40.8% |
| Palestinians | 95.8 /100 | #115 | Exceptional 40.7% |
| Immigrants | Uganda | 95.7 /100 | #116 | Exceptional 40.7% |
| Austrians | 95.5 /100 | #117 | Exceptional 40.6% |
| Croatians | 95.5 /100 | #118 | Exceptional 40.6% |
| Immigrants | Syria | 94.9 /100 | #119 | Exceptional 40.5% |
| Venezuelans | 94.7 /100 | #120 | Exceptional 40.5% |
| Moroccans | 94.6 /100 | #121 | Exceptional 40.5% |
| Immigrants | Albania | 94.4 /100 | #122 | Exceptional 40.4% |
| Lebanese | 94.3 /100 | #123 | Exceptional 40.4% |
| Immigrants | Eritrea | 94.3 /100 | #124 | Exceptional 40.4% |
| British | 94.2 /100 | #125 | Exceptional 40.4% |
| Immigrants | Eastern Africa | 94.1 /100 | #126 | Exceptional 40.4% |
| Immigrants | Jordan | 93.4 /100 | #127 | Exceptional 40.3% |
Demographics Similar to Immigrants from Bulgaria by Bachelor's Degree
In terms of bachelor's degree, the demographic groups most similar to Immigrants from Bulgaria are Bolivian (44.6%, a difference of 0.040%), Estonian (44.6%, a difference of 0.040%), Immigrants from Kuwait (44.6%, a difference of 0.060%), Immigrants from Lithuania (44.6%, a difference of 0.080%), and Immigrants from Norway (44.5%, a difference of 0.16%).
| Demographics | Rating | Rank | Bachelor's Degree |
| Immigrants | Latvia | 100.0 /100 | #39 | Exceptional 45.1% |
| Immigrants | Belarus | 100.0 /100 | #40 | Exceptional 45.0% |
| Immigrants | Malaysia | 100.0 /100 | #41 | Exceptional 45.0% |
| Immigrants | Saudi Arabia | 100.0 /100 | #42 | Exceptional 44.8% |
| Immigrants | South Africa | 99.9 /100 | #43 | Exceptional 44.8% |
| Immigrants | Lithuania | 99.9 /100 | #44 | Exceptional 44.6% |
| Immigrants | Kuwait | 99.9 /100 | #45 | Exceptional 44.6% |
| Immigrants | Bulgaria | 99.9 /100 | #46 | Exceptional 44.6% |
| Bolivians | 99.9 /100 | #47 | Exceptional 44.6% |
| Estonians | 99.9 /100 | #48 | Exceptional 44.6% |
| Immigrants | Norway | 99.9 /100 | #49 | Exceptional 44.5% |
| Immigrants | Greece | 99.9 /100 | #50 | Exceptional 44.5% |
| Asians | 99.9 /100 | #51 | Exceptional 44.4% |
| Immigrants | Spain | 99.9 /100 | #52 | Exceptional 44.3% |
| Immigrants | Asia | 99.9 /100 | #53 | Exceptional 44.3% |