Iraqi vs Immigrants from India Bachelor's Degree
COMPARE
Iraqi
Immigrants from India
Bachelor's Degree
Bachelor's Degree Comparison
Iraqis
Immigrants from India
39.0%
BACHELOR'S DEGREE
78.1/ 100
METRIC RATING
148th/ 347
METRIC RANK
51.3%
BACHELOR'S DEGREE
100.0/ 100
METRIC RATING
3rd/ 347
METRIC RANK
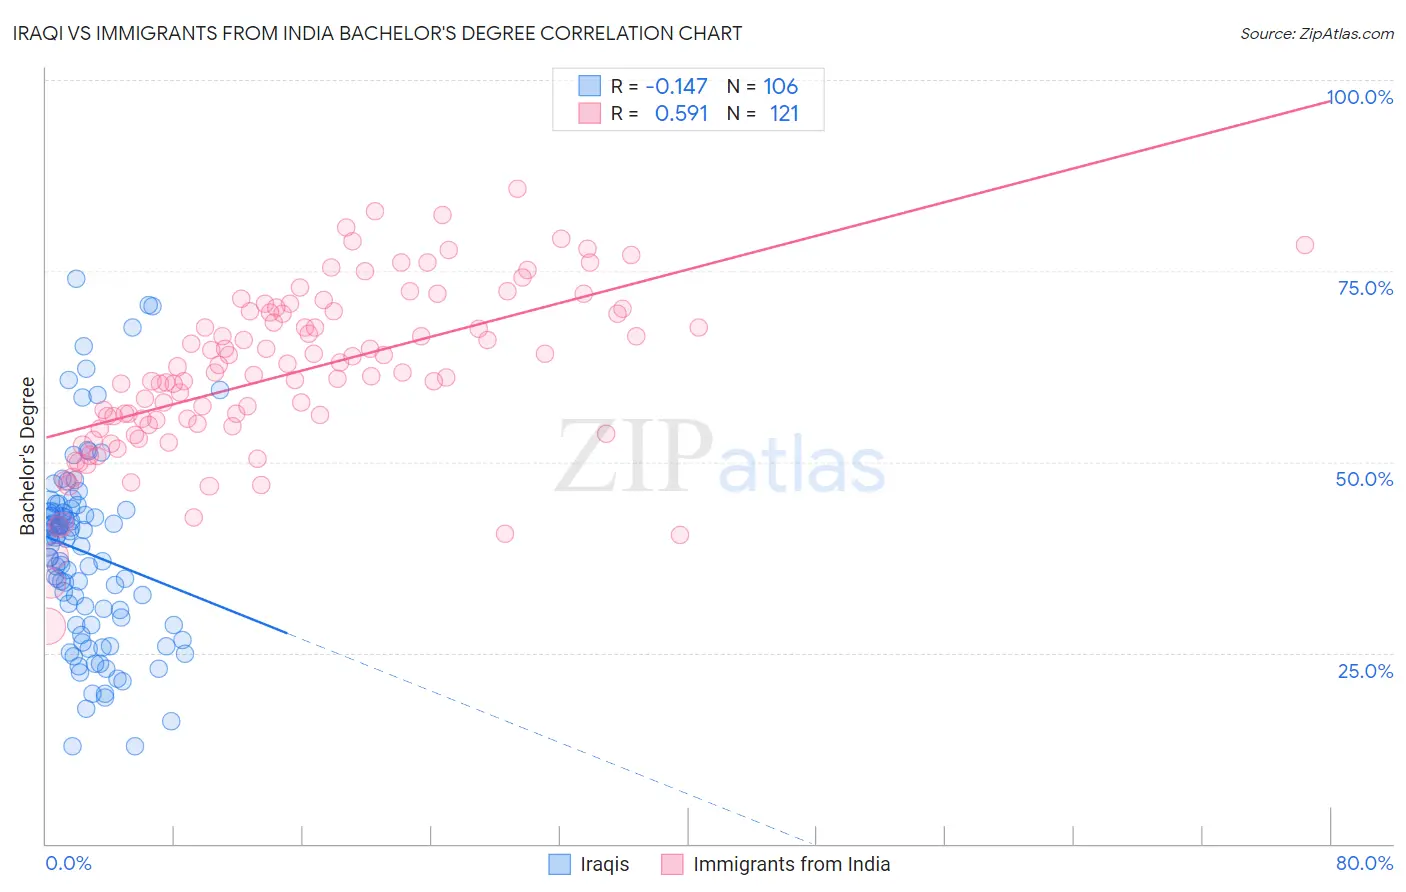
Iraqi vs Immigrants from India Bachelor's Degree Correlation Chart
The statistical analysis conducted on geographies consisting of 170,654,288 people shows a poor negative correlation between the proportion of Iraqis and percentage of population with at least bachelor's degree education in the United States with a correlation coefficient (R) of -0.147 and weighted average of 39.0%. Similarly, the statistical analysis conducted on geographies consisting of 434,046,114 people shows a substantial positive correlation between the proportion of Immigrants from India and percentage of population with at least bachelor's degree education in the United States with a correlation coefficient (R) of 0.591 and weighted average of 51.3%, a difference of 31.5%.
Bachelor's Degree Correlation Summary
| Measurement | Iraqi | Immigrants from India |
| Minimum | 12.8% | 28.5% |
| Maximum | 74.1% | 85.7% |
| Range | 61.3% | 57.2% |
| Mean | 38.1% | 61.6% |
| Median | 39.7% | 61.8% |
| Interquartile 25% (IQ1) | 28.6% | 54.8% |
| Interquartile 75% (IQ3) | 43.6% | 69.7% |
| Interquartile Range (IQR) | 15.0% | 14.9% |
| Standard Deviation (Sample) | 12.6% | 10.9% |
| Standard Deviation (Population) | 12.5% | 10.9% |
Similar Demographics by Bachelor's Degree
Demographics Similar to Iraqis by Bachelor's Degree
In terms of bachelor's degree, the demographic groups most similar to Iraqis are Immigrants from Poland (39.0%, a difference of 0.080%), South American (38.9%, a difference of 0.11%), Immigrants from Sierra Leone (39.0%, a difference of 0.14%), Swedish (39.1%, a difference of 0.17%), and Slovene (39.1%, a difference of 0.21%).
| Demographics | Rating | Rank | Bachelor's Degree |
| South American Indians | 83.6 /100 | #141 | Excellent 39.3% |
| Immigrants | North Macedonia | 81.6 /100 | #142 | Excellent 39.2% |
| Poles | 79.8 /100 | #143 | Good 39.1% |
| Immigrants | Afghanistan | 79.7 /100 | #144 | Good 39.1% |
| Slovenes | 79.5 /100 | #145 | Good 39.1% |
| Swedes | 79.2 /100 | #146 | Good 39.1% |
| Immigrants | Sierra Leone | 79.0 /100 | #147 | Good 39.0% |
| Iraqis | 78.1 /100 | #148 | Good 39.0% |
| Immigrants | Poland | 77.5 /100 | #149 | Good 39.0% |
| South Americans | 77.3 /100 | #150 | Good 38.9% |
| Immigrants | Africa | 76.5 /100 | #151 | Good 38.9% |
| Sudanese | 76.4 /100 | #152 | Good 38.9% |
| Slavs | 75.9 /100 | #153 | Good 38.9% |
| Canadians | 75.0 /100 | #154 | Good 38.8% |
| Immigrants | Kenya | 73.8 /100 | #155 | Good 38.8% |
Demographics Similar to Immigrants from India by Bachelor's Degree
In terms of bachelor's degree, the demographic groups most similar to Immigrants from India are Immigrants from Taiwan (51.2%, a difference of 0.21%), Iranian (51.0%, a difference of 0.63%), Immigrants from Singapore (51.9%, a difference of 1.2%), Okinawan (50.5%, a difference of 1.5%), and Immigrants from Iran (50.3%, a difference of 2.0%).
| Demographics | Rating | Rank | Bachelor's Degree |
| Filipinos | 100.0 /100 | #1 | Exceptional 52.7% |
| Immigrants | Singapore | 100.0 /100 | #2 | Exceptional 51.9% |
| Immigrants | India | 100.0 /100 | #3 | Exceptional 51.3% |
| Immigrants | Taiwan | 100.0 /100 | #4 | Exceptional 51.2% |
| Iranians | 100.0 /100 | #5 | Exceptional 51.0% |
| Okinawans | 100.0 /100 | #6 | Exceptional 50.5% |
| Immigrants | Iran | 100.0 /100 | #7 | Exceptional 50.3% |
| Thais | 100.0 /100 | #8 | Exceptional 50.1% |
| Immigrants | Israel | 100.0 /100 | #9 | Exceptional 50.0% |
| Cypriots | 100.0 /100 | #10 | Exceptional 49.0% |
| Immigrants | Australia | 100.0 /100 | #11 | Exceptional 48.5% |
| Immigrants | China | 100.0 /100 | #12 | Exceptional 48.4% |
| Immigrants | South Central Asia | 100.0 /100 | #13 | Exceptional 48.3% |
| Immigrants | Hong Kong | 100.0 /100 | #14 | Exceptional 48.2% |
| Immigrants | Eastern Asia | 100.0 /100 | #15 | Exceptional 48.1% |