Ute vs Immigrants from Serbia GED/Equivalency
COMPARE
Ute
Immigrants from Serbia
GED/Equivalency
GED/Equivalency Comparison
Ute
Immigrants from Serbia
81.8%
GED/EQUIVALENCY
0.0/ 100
METRIC RATING
298th/ 347
METRIC RANK
87.7%
GED/EQUIVALENCY
98.7/ 100
METRIC RATING
76th/ 347
METRIC RANK
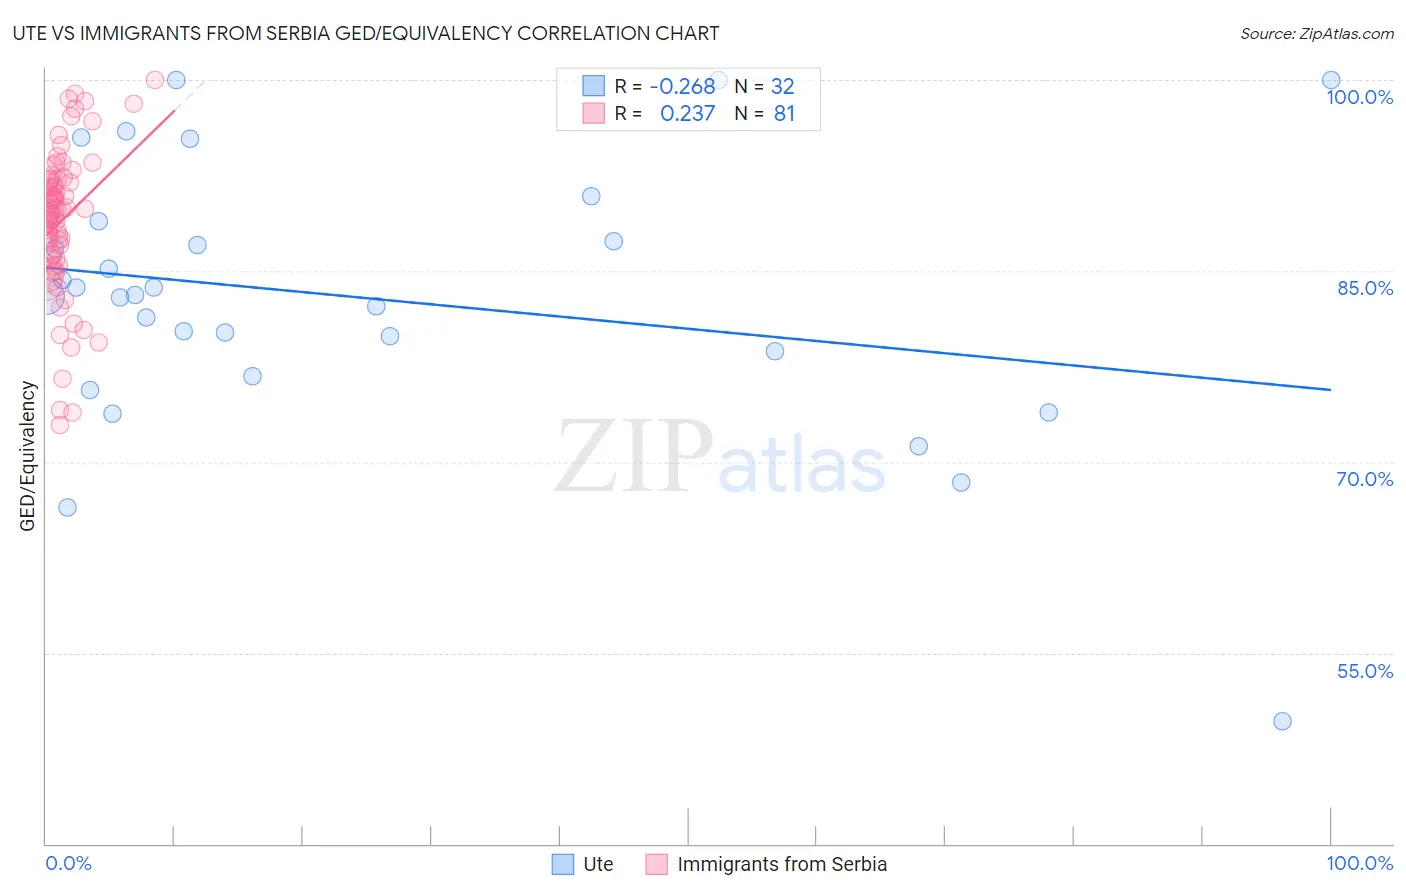
Ute vs Immigrants from Serbia GED/Equivalency Correlation Chart
The statistical analysis conducted on geographies consisting of 55,668,599 people shows a weak negative correlation between the proportion of Ute and percentage of population with at least ged/equivalency education in the United States with a correlation coefficient (R) of -0.268 and weighted average of 81.8%. Similarly, the statistical analysis conducted on geographies consisting of 131,746,424 people shows a weak positive correlation between the proportion of Immigrants from Serbia and percentage of population with at least ged/equivalency education in the United States with a correlation coefficient (R) of 0.237 and weighted average of 87.7%, a difference of 7.2%.
GED/Equivalency Correlation Summary
| Measurement | Ute | Immigrants from Serbia |
| Minimum | 49.6% | 72.9% |
| Maximum | 100.0% | 100.0% |
| Range | 50.4% | 27.1% |
| Mean | 82.9% | 88.9% |
| Median | 83.0% | 89.6% |
| Interquartile 25% (IQ1) | 77.7% | 86.2% |
| Interquartile 75% (IQ3) | 88.1% | 92.1% |
| Interquartile Range (IQR) | 10.4% | 6.0% |
| Standard Deviation (Sample) | 10.7% | 5.6% |
| Standard Deviation (Population) | 10.5% | 5.6% |
Similar Demographics by GED/Equivalency
Demographics Similar to Ute by GED/Equivalency
In terms of ged/equivalency, the demographic groups most similar to Ute are Immigrants from Bangladesh (81.9%, a difference of 0.090%), Vietnamese (81.9%, a difference of 0.14%), Ecuadorian (81.7%, a difference of 0.14%), Nepalese (81.9%, a difference of 0.17%), and Fijian (81.6%, a difference of 0.20%).
| Demographics | Rating | Rank | GED/Equivalency |
| Cubans | 0.0 /100 | #291 | Tragic 82.0% |
| Paiute | 0.0 /100 | #292 | Tragic 82.0% |
| British West Indians | 0.0 /100 | #293 | Tragic 82.0% |
| Immigrants | St. Vincent and the Grenadines | 0.0 /100 | #294 | Tragic 82.0% |
| Nepalese | 0.0 /100 | #295 | Tragic 81.9% |
| Vietnamese | 0.0 /100 | #296 | Tragic 81.9% |
| Immigrants | Bangladesh | 0.0 /100 | #297 | Tragic 81.9% |
| Ute | 0.0 /100 | #298 | Tragic 81.8% |
| Ecuadorians | 0.0 /100 | #299 | Tragic 81.7% |
| Fijians | 0.0 /100 | #300 | Tragic 81.6% |
| Dutch West Indians | 0.0 /100 | #301 | Tragic 81.6% |
| Immigrants | Haiti | 0.0 /100 | #302 | Tragic 81.6% |
| Immigrants | Portugal | 0.0 /100 | #303 | Tragic 81.6% |
| Navajo | 0.0 /100 | #304 | Tragic 81.5% |
| Immigrants | Grenada | 0.0 /100 | #305 | Tragic 81.3% |
Demographics Similar to Immigrants from Serbia by GED/Equivalency
In terms of ged/equivalency, the demographic groups most similar to Immigrants from Serbia are Scottish (87.7%, a difference of 0.010%), Slavic (87.7%, a difference of 0.010%), Immigrants from Kuwait (87.7%, a difference of 0.030%), Irish (87.6%, a difference of 0.030%), and Belgian (87.7%, a difference of 0.050%).
| Demographics | Rating | Rank | GED/Equivalency |
| Immigrants | Saudi Arabia | 99.0 /100 | #69 | Exceptional 87.8% |
| Ukrainians | 98.8 /100 | #70 | Exceptional 87.7% |
| Austrians | 98.8 /100 | #71 | Exceptional 87.7% |
| Immigrants | Moldova | 98.8 /100 | #72 | Exceptional 87.7% |
| Belgians | 98.8 /100 | #73 | Exceptional 87.7% |
| Immigrants | Kuwait | 98.8 /100 | #74 | Exceptional 87.7% |
| Scottish | 98.7 /100 | #75 | Exceptional 87.7% |
| Immigrants | Serbia | 98.7 /100 | #76 | Exceptional 87.7% |
| Slavs | 98.7 /100 | #77 | Exceptional 87.7% |
| Irish | 98.6 /100 | #78 | Exceptional 87.6% |
| English | 98.6 /100 | #79 | Exceptional 87.6% |
| Immigrants | England | 98.5 /100 | #80 | Exceptional 87.6% |
| Immigrants | Sri Lanka | 98.3 /100 | #81 | Exceptional 87.5% |
| Romanians | 98.3 /100 | #82 | Exceptional 87.5% |
| South Africans | 98.3 /100 | #83 | Exceptional 87.5% |