Turkish vs Carpatho Rusyn 11th Grade
COMPARE
Turkish
Carpatho Rusyn
11th Grade
11th Grade Comparison
Turks
Carpatho Rusyns
94.0%
11TH GRADE
99.9/ 100
METRIC RATING
51st/ 347
METRIC RANK
94.8%
11TH GRADE
100.0/ 100
METRIC RATING
5th/ 347
METRIC RANK
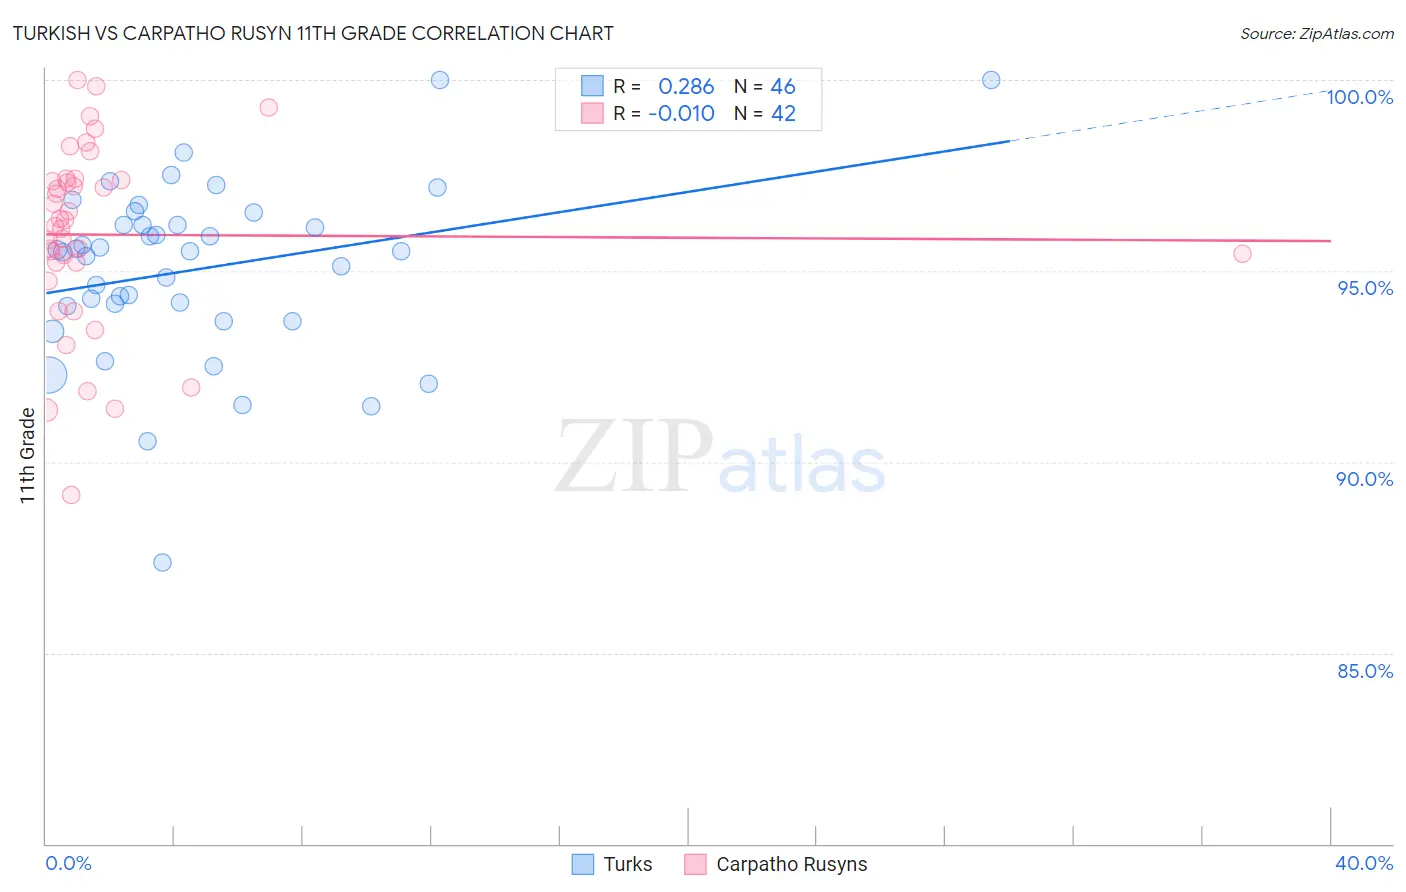
Turkish vs Carpatho Rusyn 11th Grade Correlation Chart
The statistical analysis conducted on geographies consisting of 271,864,104 people shows a weak positive correlation between the proportion of Turks and percentage of population with at least 11th grade education in the United States with a correlation coefficient (R) of 0.286 and weighted average of 94.0%. Similarly, the statistical analysis conducted on geographies consisting of 58,871,690 people shows no correlation between the proportion of Carpatho Rusyns and percentage of population with at least 11th grade education in the United States with a correlation coefficient (R) of -0.010 and weighted average of 94.8%, a difference of 0.86%.
11th Grade Correlation Summary
| Measurement | Turkish | Carpatho Rusyn |
| Minimum | 87.4% | 89.1% |
| Maximum | 100.0% | 100.0% |
| Range | 12.6% | 10.9% |
| Mean | 95.0% | 95.9% |
| Median | 95.5% | 96.3% |
| Interquartile 25% (IQ1) | 94.1% | 95.2% |
| Interquartile 75% (IQ3) | 96.2% | 97.4% |
| Interquartile Range (IQR) | 2.1% | 2.1% |
| Standard Deviation (Sample) | 2.3% | 2.4% |
| Standard Deviation (Population) | 2.3% | 2.4% |
Similar Demographics by 11th Grade
Demographics Similar to Turks by 11th Grade
In terms of 11th grade, the demographic groups most similar to Turks are Immigrants from Canada (94.0%, a difference of 0.010%), Immigrants from Australia (94.0%, a difference of 0.020%), Filipino (94.1%, a difference of 0.030%), Macedonian (94.1%, a difference of 0.030%), and Slavic (94.1%, a difference of 0.030%).
| Demographics | Rating | Rank | 11th Grade |
| Immigrants | Ireland | 99.9 /100 | #44 | Exceptional 94.1% |
| Australians | 99.9 /100 | #45 | Exceptional 94.1% |
| Serbians | 99.9 /100 | #46 | Exceptional 94.1% |
| Filipinos | 99.9 /100 | #47 | Exceptional 94.1% |
| Macedonians | 99.9 /100 | #48 | Exceptional 94.1% |
| Slavs | 99.9 /100 | #49 | Exceptional 94.1% |
| French | 99.9 /100 | #50 | Exceptional 94.1% |
| Turks | 99.9 /100 | #51 | Exceptional 94.0% |
| Immigrants | Canada | 99.9 /100 | #52 | Exceptional 94.0% |
| Immigrants | Australia | 99.9 /100 | #53 | Exceptional 94.0% |
| Immigrants | North America | 99.9 /100 | #54 | Exceptional 94.0% |
| Czechoslovakians | 99.9 /100 | #55 | Exceptional 94.0% |
| French Canadians | 99.9 /100 | #56 | Exceptional 94.0% |
| New Zealanders | 99.9 /100 | #57 | Exceptional 94.0% |
| Iranians | 99.9 /100 | #58 | Exceptional 94.0% |
Demographics Similar to Carpatho Rusyns by 11th Grade
In terms of 11th grade, the demographic groups most similar to Carpatho Rusyns are Lithuanian (94.8%, a difference of 0.050%), Slovak (94.9%, a difference of 0.060%), Slovene (94.9%, a difference of 0.080%), Swedish (94.9%, a difference of 0.10%), and Polish (94.8%, a difference of 0.10%).
| Demographics | Rating | Rank | 11th Grade |
| Norwegians | 100.0 /100 | #1 | Exceptional 95.2% |
| Swedes | 100.0 /100 | #2 | Exceptional 94.9% |
| Slovenes | 100.0 /100 | #3 | Exceptional 94.9% |
| Slovaks | 100.0 /100 | #4 | Exceptional 94.9% |
| Carpatho Rusyns | 100.0 /100 | #5 | Exceptional 94.8% |
| Lithuanians | 100.0 /100 | #6 | Exceptional 94.8% |
| Poles | 100.0 /100 | #7 | Exceptional 94.8% |
| Croatians | 100.0 /100 | #8 | Exceptional 94.7% |
| Danes | 100.0 /100 | #9 | Exceptional 94.7% |
| Finns | 100.0 /100 | #10 | Exceptional 94.7% |
| Germans | 100.0 /100 | #11 | Exceptional 94.7% |
| Latvians | 100.0 /100 | #12 | Exceptional 94.7% |
| Chinese | 100.0 /100 | #13 | Exceptional 94.6% |
| Eastern Europeans | 100.0 /100 | #14 | Exceptional 94.6% |
| Bulgarians | 100.0 /100 | #15 | Exceptional 94.5% |