South African vs Carpatho Rusyn 11th Grade
COMPARE
South African
Carpatho Rusyn
11th Grade
11th Grade Comparison
South Africans
Carpatho Rusyns
93.6%
11TH GRADE
99.2/ 100
METRIC RATING
91st/ 347
METRIC RANK
94.8%
11TH GRADE
100.0/ 100
METRIC RATING
5th/ 347
METRIC RANK
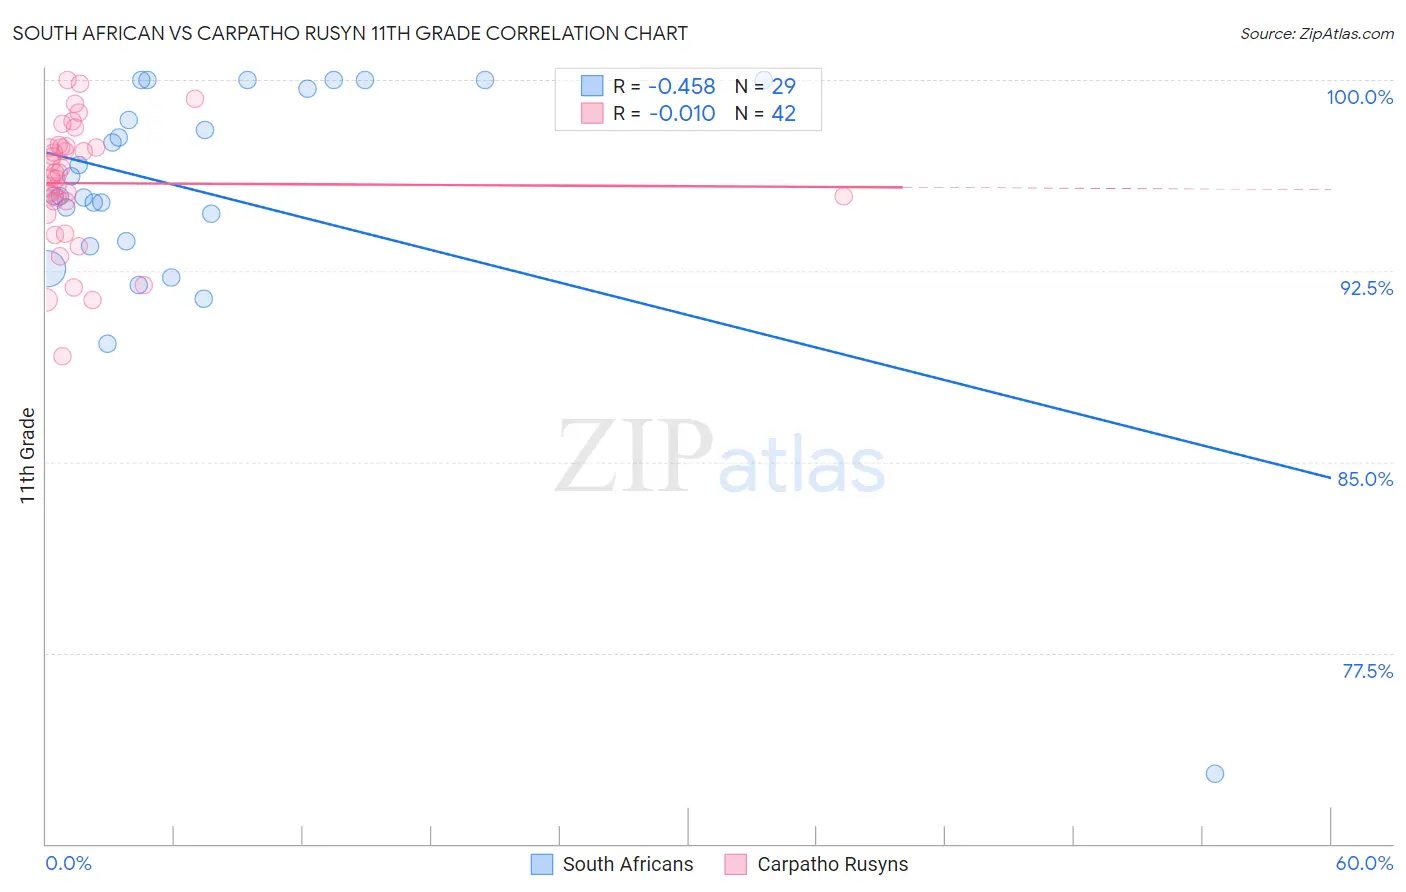
South African vs Carpatho Rusyn 11th Grade Correlation Chart
The statistical analysis conducted on geographies consisting of 182,604,532 people shows a moderate negative correlation between the proportion of South Africans and percentage of population with at least 11th grade education in the United States with a correlation coefficient (R) of -0.458 and weighted average of 93.6%. Similarly, the statistical analysis conducted on geographies consisting of 58,871,690 people shows no correlation between the proportion of Carpatho Rusyns and percentage of population with at least 11th grade education in the United States with a correlation coefficient (R) of -0.010 and weighted average of 94.8%, a difference of 1.3%.
11th Grade Correlation Summary
| Measurement | South African | Carpatho Rusyn |
| Minimum | 72.7% | 89.1% |
| Maximum | 100.0% | 100.0% |
| Range | 27.3% | 10.9% |
| Mean | 95.5% | 95.9% |
| Median | 95.4% | 96.3% |
| Interquartile 25% (IQ1) | 93.6% | 95.2% |
| Interquartile 75% (IQ3) | 99.8% | 97.4% |
| Interquartile Range (IQR) | 6.3% | 2.1% |
| Standard Deviation (Sample) | 5.3% | 2.4% |
| Standard Deviation (Population) | 5.2% | 2.4% |
Similar Demographics by 11th Grade
Demographics Similar to South Africans by 11th Grade
In terms of 11th grade, the demographic groups most similar to South Africans are Ottawa (93.6%, a difference of 0.010%), Immigrants from Bulgaria (93.6%, a difference of 0.010%), Immigrants from South Central Asia (93.6%, a difference of 0.020%), Immigrants from Western Europe (93.6%, a difference of 0.020%), and Cambodian (93.6%, a difference of 0.020%).
| Demographics | Rating | Rank | 11th Grade |
| Immigrants | Taiwan | 99.3 /100 | #84 | Exceptional 93.6% |
| Immigrants | Switzerland | 99.3 /100 | #85 | Exceptional 93.6% |
| Immigrants | South Central Asia | 99.2 /100 | #86 | Exceptional 93.6% |
| Immigrants | Western Europe | 99.2 /100 | #87 | Exceptional 93.6% |
| Cambodians | 99.2 /100 | #88 | Exceptional 93.6% |
| Burmese | 99.2 /100 | #89 | Exceptional 93.6% |
| Ottawa | 99.2 /100 | #90 | Exceptional 93.6% |
| South Africans | 99.2 /100 | #91 | Exceptional 93.6% |
| Immigrants | Bulgaria | 99.1 /100 | #92 | Exceptional 93.6% |
| Puget Sound Salish | 99.1 /100 | #93 | Exceptional 93.6% |
| Swiss | 99.0 /100 | #94 | Exceptional 93.6% |
| Immigrants | France | 99.0 /100 | #95 | Exceptional 93.6% |
| Immigrants | Turkey | 98.9 /100 | #96 | Exceptional 93.5% |
| Immigrants | Iran | 98.9 /100 | #97 | Exceptional 93.5% |
| Immigrants | Israel | 98.8 /100 | #98 | Exceptional 93.5% |
Demographics Similar to Carpatho Rusyns by 11th Grade
In terms of 11th grade, the demographic groups most similar to Carpatho Rusyns are Lithuanian (94.8%, a difference of 0.050%), Slovak (94.9%, a difference of 0.060%), Slovene (94.9%, a difference of 0.080%), Swedish (94.9%, a difference of 0.10%), and Polish (94.8%, a difference of 0.10%).
| Demographics | Rating | Rank | 11th Grade |
| Norwegians | 100.0 /100 | #1 | Exceptional 95.2% |
| Swedes | 100.0 /100 | #2 | Exceptional 94.9% |
| Slovenes | 100.0 /100 | #3 | Exceptional 94.9% |
| Slovaks | 100.0 /100 | #4 | Exceptional 94.9% |
| Carpatho Rusyns | 100.0 /100 | #5 | Exceptional 94.8% |
| Lithuanians | 100.0 /100 | #6 | Exceptional 94.8% |
| Poles | 100.0 /100 | #7 | Exceptional 94.8% |
| Croatians | 100.0 /100 | #8 | Exceptional 94.7% |
| Danes | 100.0 /100 | #9 | Exceptional 94.7% |
| Finns | 100.0 /100 | #10 | Exceptional 94.7% |
| Germans | 100.0 /100 | #11 | Exceptional 94.7% |
| Latvians | 100.0 /100 | #12 | Exceptional 94.7% |
| Chinese | 100.0 /100 | #13 | Exceptional 94.6% |
| Eastern Europeans | 100.0 /100 | #14 | Exceptional 94.6% |
| Bulgarians | 100.0 /100 | #15 | Exceptional 94.5% |