Turkish vs Barbadian 11th Grade
COMPARE
Turkish
Barbadian
11th Grade
11th Grade Comparison
Turks
Barbadians
94.0%
11TH GRADE
99.9/ 100
METRIC RATING
51st/ 347
METRIC RANK
90.8%
11TH GRADE
0.0/ 100
METRIC RATING
279th/ 347
METRIC RANK
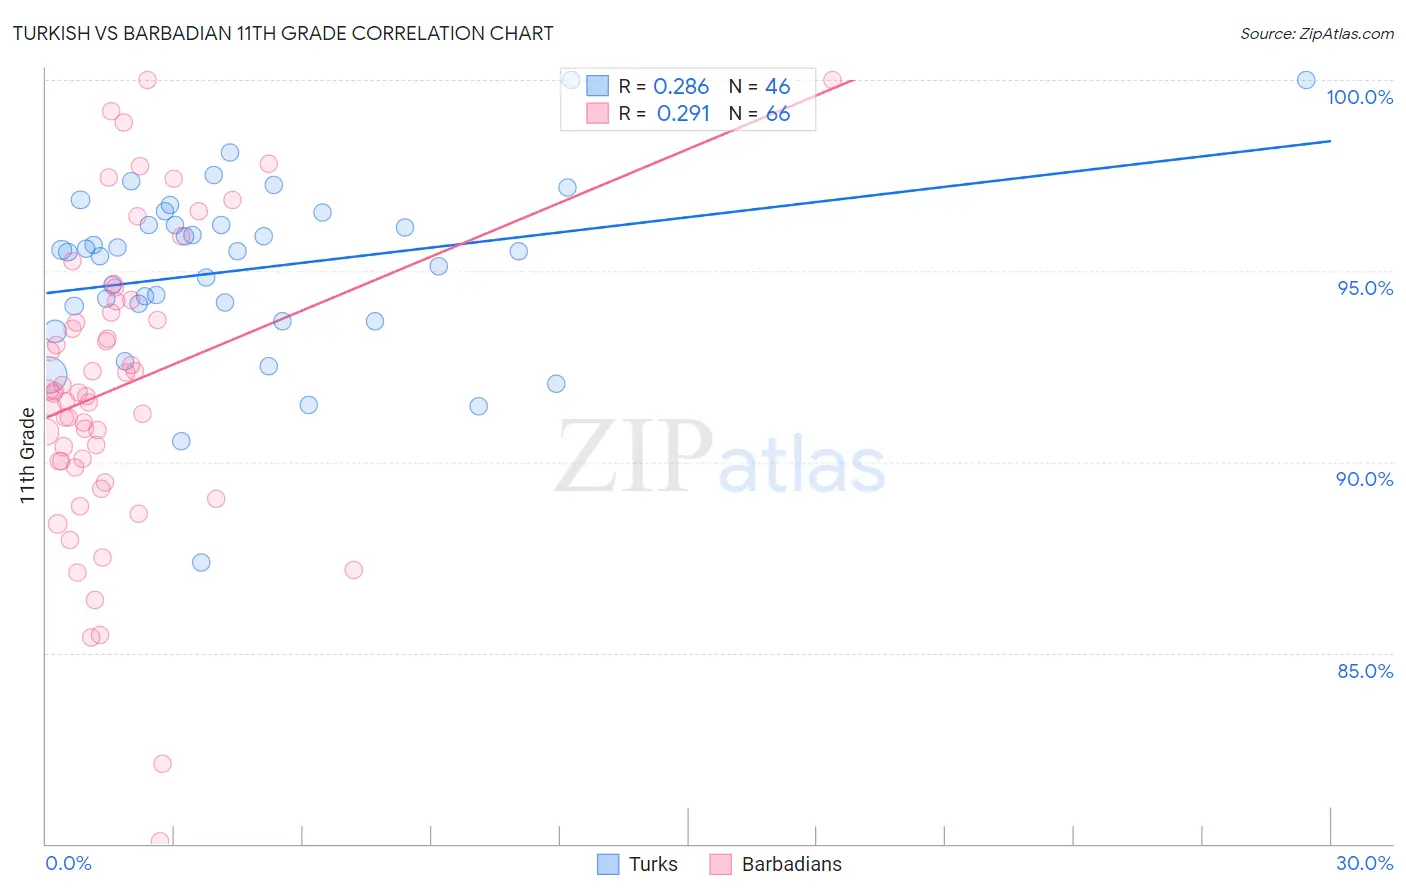
Turkish vs Barbadian 11th Grade Correlation Chart
The statistical analysis conducted on geographies consisting of 271,864,104 people shows a weak positive correlation between the proportion of Turks and percentage of population with at least 11th grade education in the United States with a correlation coefficient (R) of 0.286 and weighted average of 94.0%. Similarly, the statistical analysis conducted on geographies consisting of 141,304,456 people shows a weak positive correlation between the proportion of Barbadians and percentage of population with at least 11th grade education in the United States with a correlation coefficient (R) of 0.291 and weighted average of 90.8%, a difference of 3.6%.
11th Grade Correlation Summary
| Measurement | Turkish | Barbadian |
| Minimum | 87.4% | 80.1% |
| Maximum | 100.0% | 100.0% |
| Range | 12.6% | 19.9% |
| Mean | 95.0% | 92.0% |
| Median | 95.5% | 91.8% |
| Interquartile 25% (IQ1) | 94.1% | 90.0% |
| Interquartile 75% (IQ3) | 96.2% | 94.2% |
| Interquartile Range (IQR) | 2.1% | 4.2% |
| Standard Deviation (Sample) | 2.3% | 3.9% |
| Standard Deviation (Population) | 2.3% | 3.9% |
Similar Demographics by 11th Grade
Demographics Similar to Turks by 11th Grade
In terms of 11th grade, the demographic groups most similar to Turks are Immigrants from Canada (94.0%, a difference of 0.010%), Immigrants from Australia (94.0%, a difference of 0.020%), Filipino (94.1%, a difference of 0.030%), Macedonian (94.1%, a difference of 0.030%), and Slavic (94.1%, a difference of 0.030%).
| Demographics | Rating | Rank | 11th Grade |
| Immigrants | Ireland | 99.9 /100 | #44 | Exceptional 94.1% |
| Australians | 99.9 /100 | #45 | Exceptional 94.1% |
| Serbians | 99.9 /100 | #46 | Exceptional 94.1% |
| Filipinos | 99.9 /100 | #47 | Exceptional 94.1% |
| Macedonians | 99.9 /100 | #48 | Exceptional 94.1% |
| Slavs | 99.9 /100 | #49 | Exceptional 94.1% |
| French | 99.9 /100 | #50 | Exceptional 94.1% |
| Turks | 99.9 /100 | #51 | Exceptional 94.0% |
| Immigrants | Canada | 99.9 /100 | #52 | Exceptional 94.0% |
| Immigrants | Australia | 99.9 /100 | #53 | Exceptional 94.0% |
| Immigrants | North America | 99.9 /100 | #54 | Exceptional 94.0% |
| Czechoslovakians | 99.9 /100 | #55 | Exceptional 94.0% |
| French Canadians | 99.9 /100 | #56 | Exceptional 94.0% |
| New Zealanders | 99.9 /100 | #57 | Exceptional 94.0% |
| Iranians | 99.9 /100 | #58 | Exceptional 94.0% |
Demographics Similar to Barbadians by 11th Grade
In terms of 11th grade, the demographic groups most similar to Barbadians are Malaysian (90.8%, a difference of 0.040%), Sri Lankan (90.7%, a difference of 0.060%), Immigrants from Congo (90.9%, a difference of 0.080%), Bangladeshi (90.9%, a difference of 0.10%), and Dutch West Indian (90.7%, a difference of 0.12%).
| Demographics | Rating | Rank | 11th Grade |
| West Indians | 0.1 /100 | #272 | Tragic 91.0% |
| Paiute | 0.1 /100 | #273 | Tragic 91.0% |
| Immigrants | Trinidad and Tobago | 0.1 /100 | #274 | Tragic 90.9% |
| Immigrants | South Eastern Asia | 0.1 /100 | #275 | Tragic 90.9% |
| Bangladeshis | 0.1 /100 | #276 | Tragic 90.9% |
| Immigrants | Congo | 0.1 /100 | #277 | Tragic 90.9% |
| Malaysians | 0.1 /100 | #278 | Tragic 90.8% |
| Barbadians | 0.0 /100 | #279 | Tragic 90.8% |
| Sri Lankans | 0.0 /100 | #280 | Tragic 90.7% |
| Dutch West Indians | 0.0 /100 | #281 | Tragic 90.7% |
| Immigrants | St. Vincent and the Grenadines | 0.0 /100 | #282 | Tragic 90.7% |
| Immigrants | Barbados | 0.0 /100 | #283 | Tragic 90.7% |
| Immigrants | Laos | 0.0 /100 | #284 | Tragic 90.5% |
| Immigrants | Burma/Myanmar | 0.0 /100 | #285 | Tragic 90.4% |
| Immigrants | West Indies | 0.0 /100 | #286 | Tragic 90.4% |