Trinidadian and Tobagonian vs Immigrants from Sudan No Schooling Completed
COMPARE
Trinidadian and Tobagonian
Immigrants from Sudan
No Schooling Completed
No Schooling Completed Comparison
Trinidadians and Tobagonians
Immigrants from Sudan
2.6%
NO SCHOOLING COMPLETED
0.1/ 100
METRIC RATING
280th/ 347
METRIC RANK
2.3%
NO SCHOOLING COMPLETED
5.0/ 100
METRIC RATING
221st/ 347
METRIC RANK
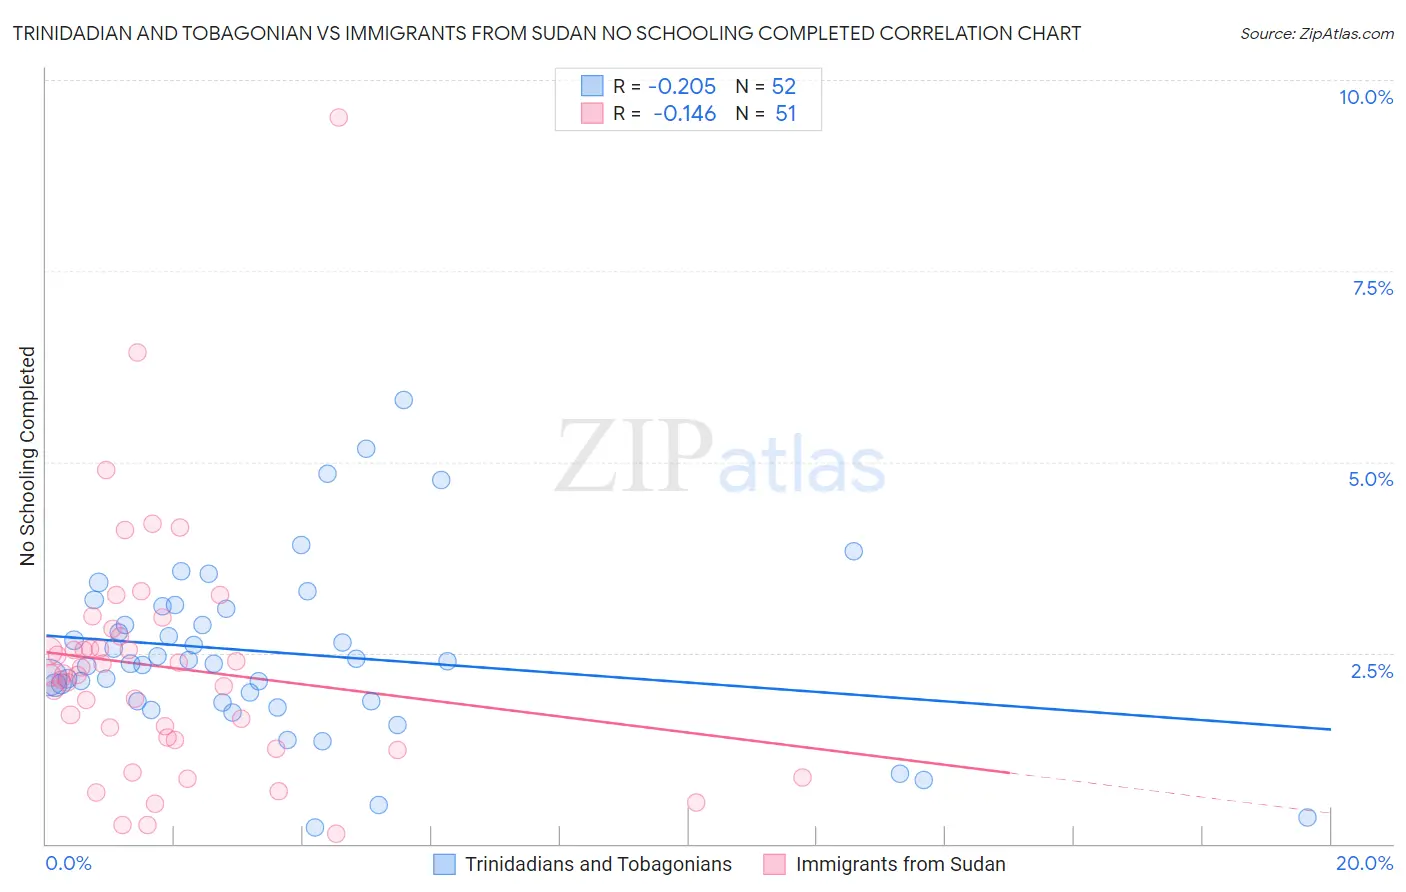
Trinidadian and Tobagonian vs Immigrants from Sudan No Schooling Completed Correlation Chart
The statistical analysis conducted on geographies consisting of 219,048,767 people shows a weak negative correlation between the proportion of Trinidadians and Tobagonians and percentage of population with no schooling in the United States with a correlation coefficient (R) of -0.205 and weighted average of 2.6%. Similarly, the statistical analysis conducted on geographies consisting of 118,727,299 people shows a poor negative correlation between the proportion of Immigrants from Sudan and percentage of population with no schooling in the United States with a correlation coefficient (R) of -0.146 and weighted average of 2.3%, a difference of 13.1%.
No Schooling Completed Correlation Summary
| Measurement | Trinidadian and Tobagonian | Immigrants from Sudan |
| Minimum | 0.22% | 0.12% |
| Maximum | 5.8% | 9.5% |
| Range | 5.6% | 9.4% |
| Mean | 2.5% | 2.3% |
| Median | 2.4% | 2.2% |
| Interquartile 25% (IQ1) | 1.9% | 1.4% |
| Interquartile 75% (IQ3) | 3.1% | 2.7% |
| Interquartile Range (IQR) | 1.2% | 1.4% |
| Standard Deviation (Sample) | 1.1% | 1.6% |
| Standard Deviation (Population) | 1.1% | 1.6% |
Similar Demographics by No Schooling Completed
Demographics Similar to Trinidadians and Tobagonians by No Schooling Completed
In terms of no schooling completed, the demographic groups most similar to Trinidadians and Tobagonians are Barbadian (2.6%, a difference of 0.020%), Afghan (2.6%, a difference of 0.080%), Immigrants from Ghana (2.6%, a difference of 0.28%), Immigrants from Uzbekistan (2.6%, a difference of 0.56%), and Immigrants from Philippines (2.6%, a difference of 0.76%).
| Demographics | Rating | Rank | No Schooling Completed |
| Immigrants | Cameroon | 0.1 /100 | #273 | Tragic 2.5% |
| Ghanaians | 0.1 /100 | #274 | Tragic 2.6% |
| Immigrants | China | 0.1 /100 | #275 | Tragic 2.6% |
| Immigrants | Western Africa | 0.1 /100 | #276 | Tragic 2.6% |
| Immigrants | Philippines | 0.1 /100 | #277 | Tragic 2.6% |
| Immigrants | Uzbekistan | 0.1 /100 | #278 | Tragic 2.6% |
| Barbadians | 0.1 /100 | #279 | Tragic 2.6% |
| Trinidadians and Tobagonians | 0.1 /100 | #280 | Tragic 2.6% |
| Afghans | 0.1 /100 | #281 | Tragic 2.6% |
| Immigrants | Ghana | 0.1 /100 | #282 | Tragic 2.6% |
| Immigrants | Trinidad and Tobago | 0.0 /100 | #283 | Tragic 2.6% |
| Immigrants | West Indies | 0.0 /100 | #284 | Tragic 2.7% |
| Immigrants | Barbados | 0.0 /100 | #285 | Tragic 2.7% |
| Immigrants | Portugal | 0.0 /100 | #286 | Tragic 2.7% |
| Immigrants | Afghanistan | 0.0 /100 | #287 | Tragic 2.7% |
Demographics Similar to Immigrants from Sudan by No Schooling Completed
In terms of no schooling completed, the demographic groups most similar to Immigrants from Sudan are Immigrants from Costa Rica (2.3%, a difference of 0.090%), Subsaharan African (2.3%, a difference of 0.17%), Immigrants from Lebanon (2.3%, a difference of 0.33%), Senegalese (2.3%, a difference of 0.35%), and Tohono O'odham (2.3%, a difference of 0.61%).
| Demographics | Rating | Rank | No Schooling Completed |
| Samoans | 8.2 /100 | #214 | Tragic 2.3% |
| Immigrants | Zaire | 7.2 /100 | #215 | Tragic 2.3% |
| Tongans | 6.8 /100 | #216 | Tragic 2.3% |
| Immigrants | Syria | 6.6 /100 | #217 | Tragic 2.3% |
| Immigrants | Nepal | 6.4 /100 | #218 | Tragic 2.3% |
| Senegalese | 5.6 /100 | #219 | Tragic 2.3% |
| Immigrants | Costa Rica | 5.1 /100 | #220 | Tragic 2.3% |
| Immigrants | Sudan | 5.0 /100 | #221 | Tragic 2.3% |
| Sub-Saharan Africans | 4.7 /100 | #222 | Tragic 2.3% |
| Immigrants | Lebanon | 4.5 /100 | #223 | Tragic 2.3% |
| Tohono O'odham | 4.1 /100 | #224 | Tragic 2.3% |
| Sudanese | 4.1 /100 | #225 | Tragic 2.3% |
| Sierra Leoneans | 4.1 /100 | #226 | Tragic 2.3% |
| Immigrants | Uganda | 4.0 /100 | #227 | Tragic 2.3% |
| U.S. Virgin Islanders | 3.7 /100 | #228 | Tragic 2.3% |