Trinidadian and Tobagonian vs German Russian No Schooling Completed
COMPARE
Trinidadian and Tobagonian
German Russian
No Schooling Completed
No Schooling Completed Comparison
Trinidadians and Tobagonians
German Russians
2.6%
NO SCHOOLING COMPLETED
0.1/ 100
METRIC RATING
280th/ 347
METRIC RANK
1.8%
NO SCHOOLING COMPLETED
97.5/ 100
METRIC RATING
105th/ 347
METRIC RANK
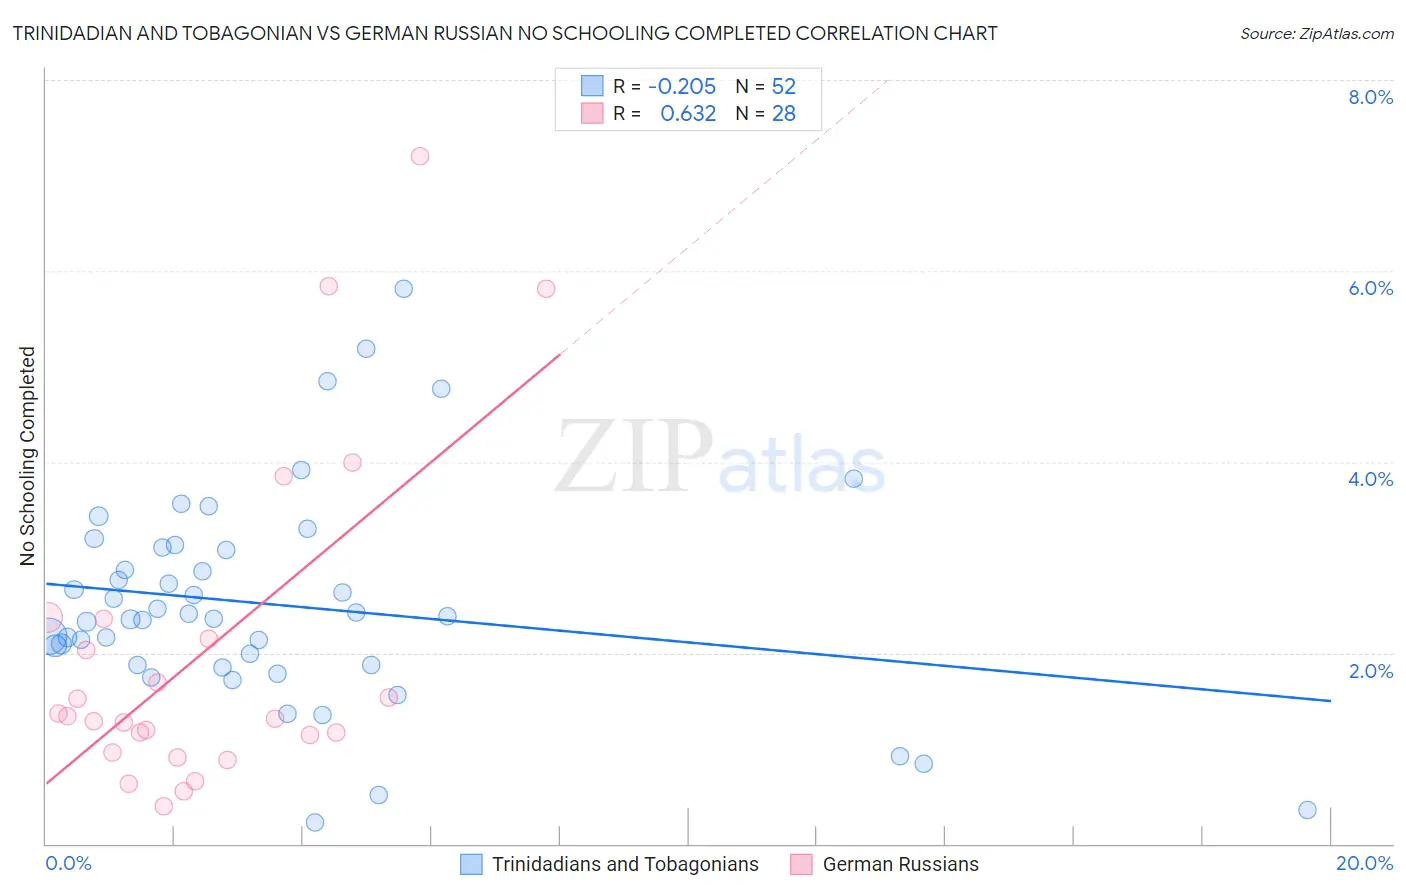
Trinidadian and Tobagonian vs German Russian No Schooling Completed Correlation Chart
The statistical analysis conducted on geographies consisting of 219,048,767 people shows a weak negative correlation between the proportion of Trinidadians and Tobagonians and percentage of population with no schooling in the United States with a correlation coefficient (R) of -0.205 and weighted average of 2.6%. Similarly, the statistical analysis conducted on geographies consisting of 96,119,740 people shows a significant positive correlation between the proportion of German Russians and percentage of population with no schooling in the United States with a correlation coefficient (R) of 0.632 and weighted average of 1.8%, a difference of 41.7%.
No Schooling Completed Correlation Summary
| Measurement | Trinidadian and Tobagonian | German Russian |
| Minimum | 0.22% | 0.39% |
| Maximum | 5.8% | 7.2% |
| Range | 5.6% | 6.8% |
| Mean | 2.5% | 2.0% |
| Median | 2.4% | 1.3% |
| Interquartile 25% (IQ1) | 1.9% | 1.0% |
| Interquartile 75% (IQ3) | 3.1% | 2.3% |
| Interquartile Range (IQR) | 1.2% | 1.2% |
| Standard Deviation (Sample) | 1.1% | 1.7% |
| Standard Deviation (Population) | 1.1% | 1.7% |
Similar Demographics by No Schooling Completed
Demographics Similar to Trinidadians and Tobagonians by No Schooling Completed
In terms of no schooling completed, the demographic groups most similar to Trinidadians and Tobagonians are Barbadian (2.6%, a difference of 0.020%), Afghan (2.6%, a difference of 0.080%), Immigrants from Ghana (2.6%, a difference of 0.28%), Immigrants from Uzbekistan (2.6%, a difference of 0.56%), and Immigrants from Philippines (2.6%, a difference of 0.76%).
| Demographics | Rating | Rank | No Schooling Completed |
| Immigrants | Cameroon | 0.1 /100 | #273 | Tragic 2.5% |
| Ghanaians | 0.1 /100 | #274 | Tragic 2.6% |
| Immigrants | China | 0.1 /100 | #275 | Tragic 2.6% |
| Immigrants | Western Africa | 0.1 /100 | #276 | Tragic 2.6% |
| Immigrants | Philippines | 0.1 /100 | #277 | Tragic 2.6% |
| Immigrants | Uzbekistan | 0.1 /100 | #278 | Tragic 2.6% |
| Barbadians | 0.1 /100 | #279 | Tragic 2.6% |
| Trinidadians and Tobagonians | 0.1 /100 | #280 | Tragic 2.6% |
| Afghans | 0.1 /100 | #281 | Tragic 2.6% |
| Immigrants | Ghana | 0.1 /100 | #282 | Tragic 2.6% |
| Immigrants | Trinidad and Tobago | 0.0 /100 | #283 | Tragic 2.6% |
| Immigrants | West Indies | 0.0 /100 | #284 | Tragic 2.7% |
| Immigrants | Barbados | 0.0 /100 | #285 | Tragic 2.7% |
| Immigrants | Portugal | 0.0 /100 | #286 | Tragic 2.7% |
| Immigrants | Afghanistan | 0.0 /100 | #287 | Tragic 2.7% |
Demographics Similar to German Russians by No Schooling Completed
In terms of no schooling completed, the demographic groups most similar to German Russians are Thai (1.8%, a difference of 0.020%), Immigrants from France (1.8%, a difference of 0.40%), Yugoslavian (1.8%, a difference of 0.44%), Basque (1.8%, a difference of 0.60%), and Immigrants from Switzerland (1.8%, a difference of 0.65%).
| Demographics | Rating | Rank | No Schooling Completed |
| Iranians | 98.2 /100 | #98 | Exceptional 1.8% |
| Choctaw | 98.1 /100 | #99 | Exceptional 1.8% |
| Immigrants | Singapore | 98.0 /100 | #100 | Exceptional 1.8% |
| Immigrants | Czechoslovakia | 97.9 /100 | #101 | Exceptional 1.8% |
| Immigrants | Switzerland | 97.9 /100 | #102 | Exceptional 1.8% |
| Basques | 97.9 /100 | #103 | Exceptional 1.8% |
| Thais | 97.5 /100 | #104 | Exceptional 1.8% |
| German Russians | 97.5 /100 | #105 | Exceptional 1.8% |
| Immigrants | France | 97.3 /100 | #106 | Exceptional 1.8% |
| Yugoslavians | 97.2 /100 | #107 | Exceptional 1.8% |
| Okinawans | 97.1 /100 | #108 | Exceptional 1.8% |
| Immigrants | Saudi Arabia | 96.8 /100 | #109 | Exceptional 1.9% |
| Immigrants | Latvia | 96.7 /100 | #110 | Exceptional 1.9% |
| Immigrants | Japan | 96.6 /100 | #111 | Exceptional 1.9% |
| Pueblo | 96.4 /100 | #112 | Exceptional 1.9% |