Nepalese vs German Russian No Schooling Completed
COMPARE
Nepalese
German Russian
No Schooling Completed
No Schooling Completed Comparison
Nepalese
German Russians
3.8%
NO SCHOOLING COMPLETED
0.0/ 100
METRIC RATING
344th/ 347
METRIC RANK
1.8%
NO SCHOOLING COMPLETED
97.5/ 100
METRIC RATING
105th/ 347
METRIC RANK
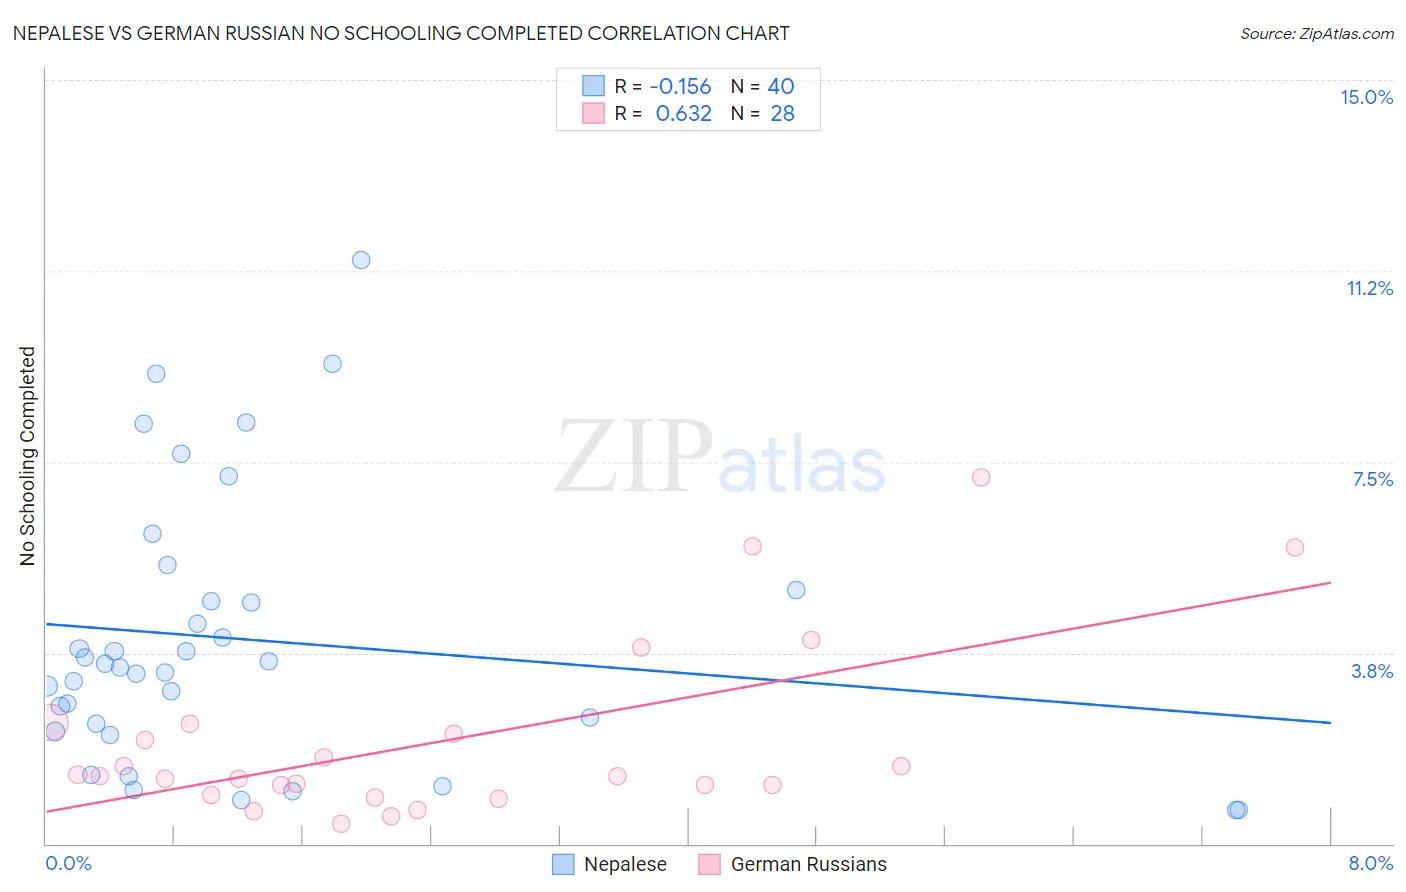
Nepalese vs German Russian No Schooling Completed Correlation Chart
The statistical analysis conducted on geographies consisting of 24,510,165 people shows a poor negative correlation between the proportion of Nepalese and percentage of population with no schooling in the United States with a correlation coefficient (R) of -0.156 and weighted average of 3.8%. Similarly, the statistical analysis conducted on geographies consisting of 96,119,740 people shows a significant positive correlation between the proportion of German Russians and percentage of population with no schooling in the United States with a correlation coefficient (R) of 0.632 and weighted average of 1.8%, a difference of 107.7%.
No Schooling Completed Correlation Summary
| Measurement | Nepalese | German Russian |
| Minimum | 0.66% | 0.39% |
| Maximum | 11.5% | 7.2% |
| Range | 10.8% | 6.8% |
| Mean | 4.0% | 2.0% |
| Median | 3.5% | 1.3% |
| Interquartile 25% (IQ1) | 2.3% | 1.0% |
| Interquartile 75% (IQ3) | 4.9% | 2.3% |
| Interquartile Range (IQR) | 2.6% | 1.2% |
| Standard Deviation (Sample) | 2.6% | 1.7% |
| Standard Deviation (Population) | 2.6% | 1.7% |
Similar Demographics by No Schooling Completed
Demographics Similar to Nepalese by No Schooling Completed
In terms of no schooling completed, the demographic groups most similar to Nepalese are Salvadoran (3.7%, a difference of 1.7%), Immigrants from El Salvador (3.9%, a difference of 1.8%), Immigrants from Mexico (3.6%, a difference of 4.5%), Immigrants from Central America (3.6%, a difference of 5.3%), and Immigrants from Guatemala (3.6%, a difference of 6.4%).
| Demographics | Rating | Rank | No Schooling Completed |
| Immigrants | Dominican Republic | 0.0 /100 | #333 | Tragic 3.4% |
| Guatemalans | 0.0 /100 | #334 | Tragic 3.5% |
| Immigrants | Cambodia | 0.0 /100 | #335 | Tragic 3.5% |
| Immigrants | Fiji | 0.0 /100 | #336 | Tragic 3.5% |
| Immigrants | Cabo Verde | 0.0 /100 | #337 | Tragic 3.5% |
| Bangladeshis | 0.0 /100 | #338 | Tragic 3.5% |
| Yakama | 0.0 /100 | #339 | Tragic 3.6% |
| Immigrants | Guatemala | 0.0 /100 | #340 | Tragic 3.6% |
| Immigrants | Central America | 0.0 /100 | #341 | Tragic 3.6% |
| Immigrants | Mexico | 0.0 /100 | #342 | Tragic 3.6% |
| Salvadorans | 0.0 /100 | #343 | Tragic 3.7% |
| Nepalese | 0.0 /100 | #344 | Tragic 3.8% |
| Immigrants | El Salvador | 0.0 /100 | #345 | Tragic 3.9% |
| Immigrants | Yemen | 0.0 /100 | #346 | Tragic 4.1% |
| Spanish American Indians | 0.0 /100 | #347 | Tragic 4.2% |
Demographics Similar to German Russians by No Schooling Completed
In terms of no schooling completed, the demographic groups most similar to German Russians are Thai (1.8%, a difference of 0.020%), Immigrants from France (1.8%, a difference of 0.40%), Yugoslavian (1.8%, a difference of 0.44%), Basque (1.8%, a difference of 0.60%), and Immigrants from Switzerland (1.8%, a difference of 0.65%).
| Demographics | Rating | Rank | No Schooling Completed |
| Iranians | 98.2 /100 | #98 | Exceptional 1.8% |
| Choctaw | 98.1 /100 | #99 | Exceptional 1.8% |
| Immigrants | Singapore | 98.0 /100 | #100 | Exceptional 1.8% |
| Immigrants | Czechoslovakia | 97.9 /100 | #101 | Exceptional 1.8% |
| Immigrants | Switzerland | 97.9 /100 | #102 | Exceptional 1.8% |
| Basques | 97.9 /100 | #103 | Exceptional 1.8% |
| Thais | 97.5 /100 | #104 | Exceptional 1.8% |
| German Russians | 97.5 /100 | #105 | Exceptional 1.8% |
| Immigrants | France | 97.3 /100 | #106 | Exceptional 1.8% |
| Yugoslavians | 97.2 /100 | #107 | Exceptional 1.8% |
| Okinawans | 97.1 /100 | #108 | Exceptional 1.8% |
| Immigrants | Saudi Arabia | 96.8 /100 | #109 | Exceptional 1.9% |
| Immigrants | Latvia | 96.7 /100 | #110 | Exceptional 1.9% |
| Immigrants | Japan | 96.6 /100 | #111 | Exceptional 1.9% |
| Pueblo | 96.4 /100 | #112 | Exceptional 1.9% |