Puget Sound Salish vs Immigrants from Belgium No Schooling Completed
COMPARE
Puget Sound Salish
Immigrants from Belgium
No Schooling Completed
No Schooling Completed Comparison
Puget Sound Salish
Immigrants from Belgium
1.8%
NO SCHOOLING COMPLETED
98.5/ 100
METRIC RATING
95th/ 347
METRIC RANK
1.7%
NO SCHOOLING COMPLETED
99.3/ 100
METRIC RATING
75th/ 347
METRIC RANK
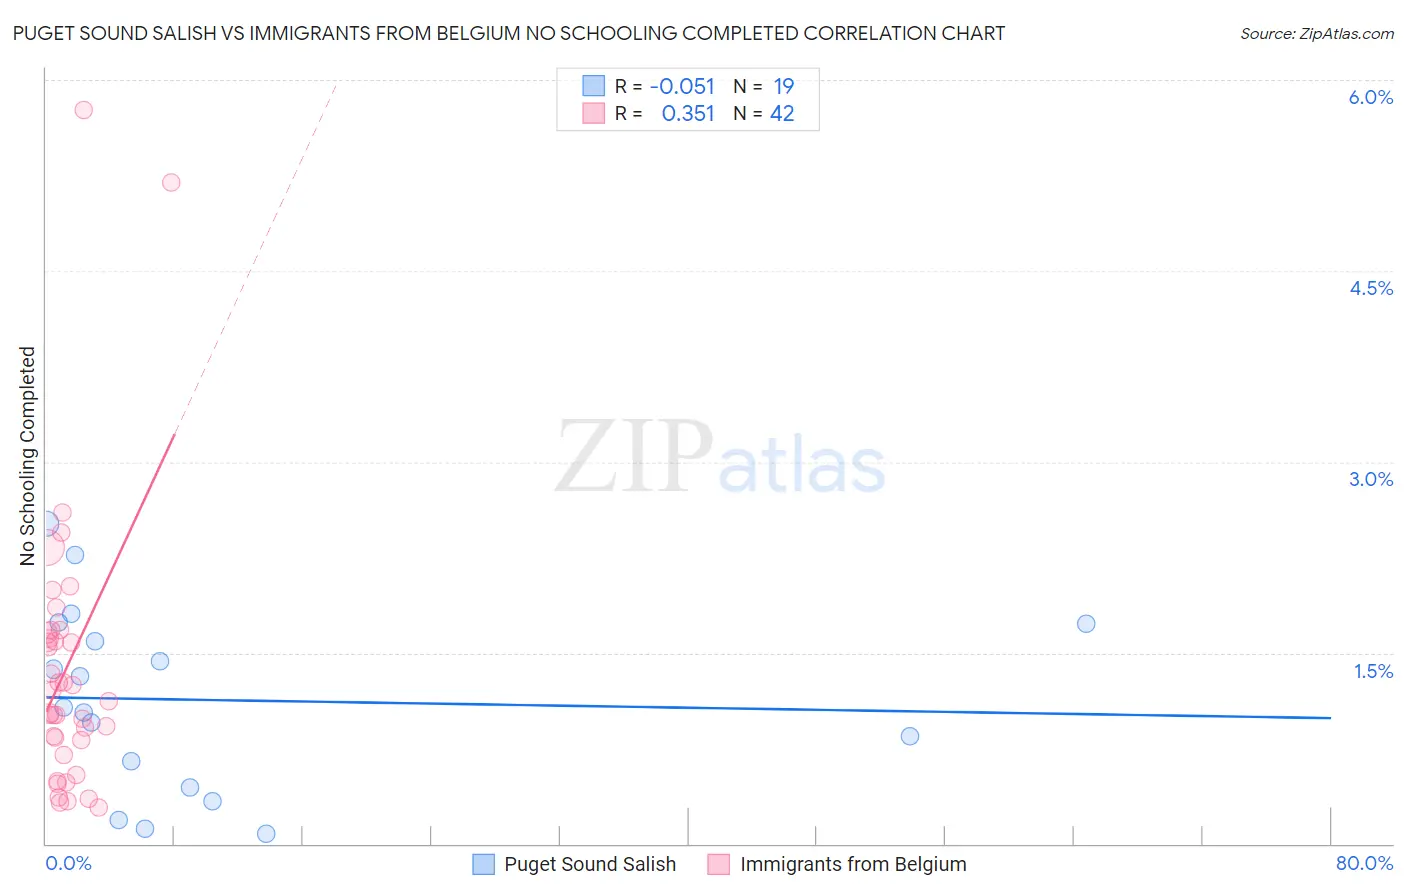
Puget Sound Salish vs Immigrants from Belgium No Schooling Completed Correlation Chart
The statistical analysis conducted on geographies consisting of 45,937,154 people shows a slight negative correlation between the proportion of Puget Sound Salish and percentage of population with no schooling in the United States with a correlation coefficient (R) of -0.051 and weighted average of 1.8%. Similarly, the statistical analysis conducted on geographies consisting of 145,930,186 people shows a mild positive correlation between the proportion of Immigrants from Belgium and percentage of population with no schooling in the United States with a correlation coefficient (R) of 0.351 and weighted average of 1.7%, a difference of 3.4%.
No Schooling Completed Correlation Summary
| Measurement | Puget Sound Salish | Immigrants from Belgium |
| Minimum | 0.082% | 0.28% |
| Maximum | 2.5% | 5.8% |
| Range | 2.4% | 5.5% |
| Mean | 1.1% | 1.4% |
| Median | 1.1% | 1.2% |
| Interquartile 25% (IQ1) | 0.45% | 0.82% |
| Interquartile 75% (IQ3) | 1.7% | 1.7% |
| Interquartile Range (IQR) | 1.3% | 0.84% |
| Standard Deviation (Sample) | 0.72% | 1.1% |
| Standard Deviation (Population) | 0.70% | 1.1% |
Demographics Similar to Puget Sound Salish and Immigrants from Belgium by No Schooling Completed
In terms of no schooling completed, the demographic groups most similar to Puget Sound Salish are Nonimmigrants (1.8%, a difference of 0.010%), Turkish (1.8%, a difference of 0.51%), Romanian (1.8%, a difference of 0.88%), Immigrants from Germany (1.8%, a difference of 1.4%), and Sioux (1.8%, a difference of 1.5%). Similarly, the demographic groups most similar to Immigrants from Belgium are Cherokee (1.7%, a difference of 0.040%), Immigrants from Sweden (1.7%, a difference of 0.19%), Delaware (1.7%, a difference of 0.23%), Macedonian (1.7%, a difference of 0.31%), and Cypriot (1.7%, a difference of 0.32%).
| Demographics | Rating | Rank | No Schooling Completed |
| Immigrants | Belgium | 99.3 /100 | #75 | Exceptional 1.7% |
| Cherokee | 99.3 /100 | #76 | Exceptional 1.7% |
| Immigrants | Sweden | 99.3 /100 | #77 | Exceptional 1.7% |
| Delaware | 99.3 /100 | #78 | Exceptional 1.7% |
| Macedonians | 99.3 /100 | #79 | Exceptional 1.7% |
| Cypriots | 99.3 /100 | #80 | Exceptional 1.7% |
| Icelanders | 99.3 /100 | #81 | Exceptional 1.7% |
| Immigrants | South Africa | 99.3 /100 | #82 | Exceptional 1.7% |
| Potawatomi | 99.3 /100 | #83 | Exceptional 1.7% |
| Immigrants | Denmark | 99.2 /100 | #84 | Exceptional 1.7% |
| Immigrants | Australia | 99.2 /100 | #85 | Exceptional 1.7% |
| Ukrainians | 99.2 /100 | #86 | Exceptional 1.8% |
| Osage | 99.2 /100 | #87 | Exceptional 1.8% |
| Immigrants | Western Europe | 99.2 /100 | #88 | Exceptional 1.8% |
| South Africans | 99.1 /100 | #89 | Exceptional 1.8% |
| Sioux | 99.0 /100 | #90 | Exceptional 1.8% |
| Immigrants | Germany | 99.0 /100 | #91 | Exceptional 1.8% |
| Romanians | 98.8 /100 | #92 | Exceptional 1.8% |
| Turks | 98.7 /100 | #93 | Exceptional 1.8% |
| Immigrants | Nonimmigrants | 98.5 /100 | #94 | Exceptional 1.8% |
| Puget Sound Salish | 98.5 /100 | #95 | Exceptional 1.8% |