Spanish American Indian vs Immigrants from Uganda Doctorate Degree
COMPARE
Spanish American Indian
Immigrants from Uganda
Doctorate Degree
Doctorate Degree Comparison
Spanish American Indians
Immigrants from Uganda
1.1%
DOCTORATE DEGREE
0.0/ 100
METRIC RATING
346th/ 347
METRIC RANK
2.2%
DOCTORATE DEGREE
99.6/ 100
METRIC RATING
82nd/ 347
METRIC RANK
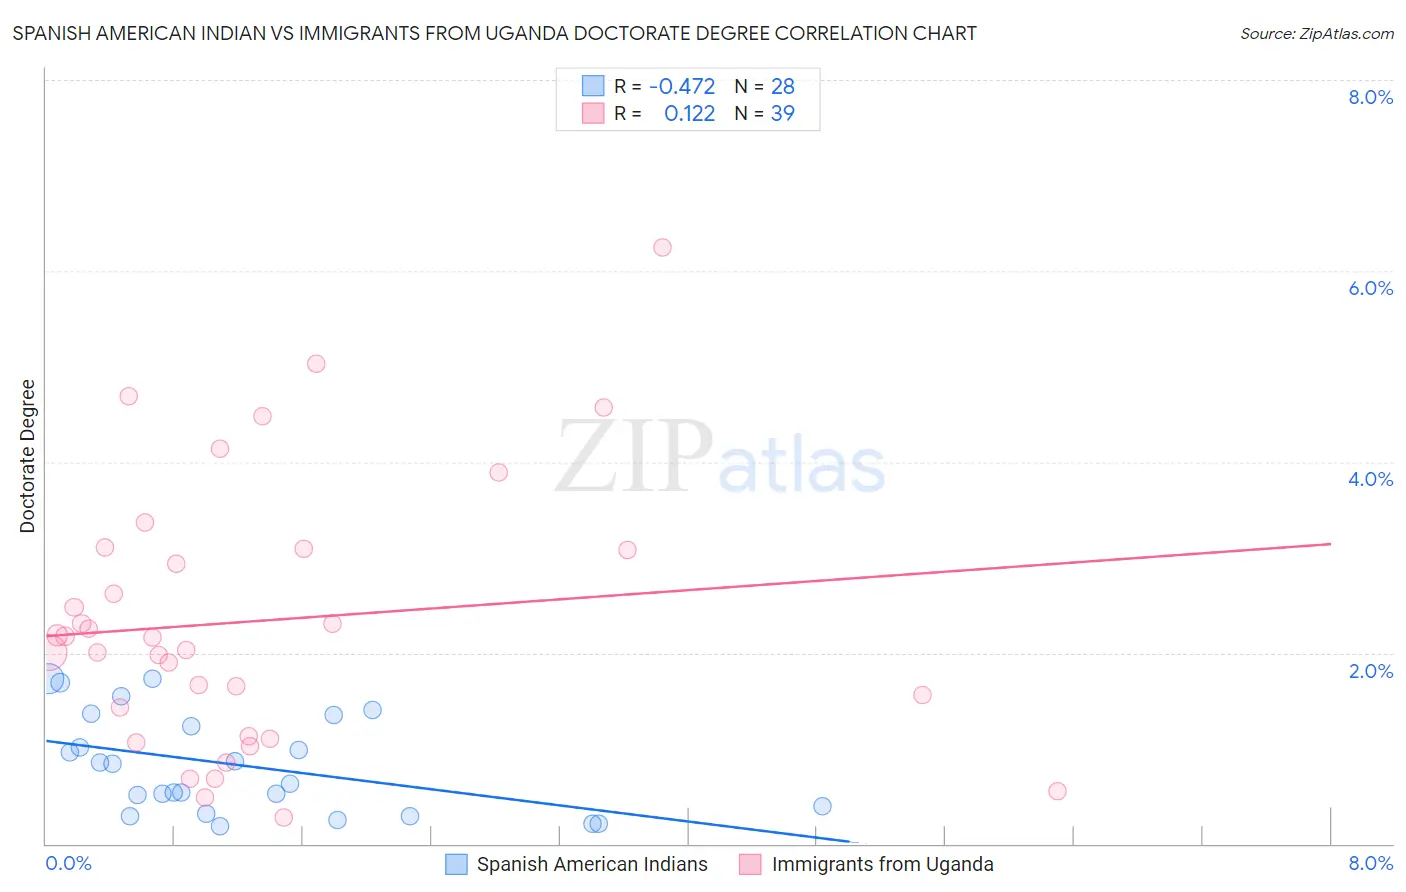
Spanish American Indian vs Immigrants from Uganda Doctorate Degree Correlation Chart
The statistical analysis conducted on geographies consisting of 72,925,634 people shows a moderate negative correlation between the proportion of Spanish American Indians and percentage of population with at least doctorate degree education in the United States with a correlation coefficient (R) of -0.472 and weighted average of 1.1%. Similarly, the statistical analysis conducted on geographies consisting of 125,795,140 people shows a poor positive correlation between the proportion of Immigrants from Uganda and percentage of population with at least doctorate degree education in the United States with a correlation coefficient (R) of 0.122 and weighted average of 2.2%, a difference of 108.9%.
Doctorate Degree Correlation Summary
| Measurement | Spanish American Indian | Immigrants from Uganda |
| Minimum | 0.18% | 0.28% |
| Maximum | 1.7% | 6.2% |
| Range | 1.6% | 6.0% |
| Mean | 0.82% | 2.3% |
| Median | 0.73% | 2.2% |
| Interquartile 25% (IQ1) | 0.36% | 1.1% |
| Interquartile 75% (IQ3) | 1.3% | 3.1% |
| Interquartile Range (IQR) | 0.93% | 2.0% |
| Standard Deviation (Sample) | 0.51% | 1.4% |
| Standard Deviation (Population) | 0.50% | 1.4% |
Similar Demographics by Doctorate Degree
Demographics Similar to Spanish American Indians by Doctorate Degree
In terms of doctorate degree, the demographic groups most similar to Spanish American Indians are Lumbee (1.1%, a difference of 2.8%), Immigrants from Mexico (1.1%, a difference of 4.4%), Fijian (1.1%, a difference of 6.5%), Arapaho (1.2%, a difference of 10.2%), and Houma (0.96%, a difference of 10.5%).
| Demographics | Rating | Rank | Doctorate Degree |
| Immigrants | Caribbean | 0.0 /100 | #333 | Tragic 1.3% |
| Immigrants | Dominican Republic | 0.0 /100 | #334 | Tragic 1.3% |
| Immigrants | Haiti | 0.0 /100 | #335 | Tragic 1.3% |
| Nepalese | 0.0 /100 | #336 | Tragic 1.3% |
| Bangladeshis | 0.0 /100 | #337 | Tragic 1.2% |
| Puget Sound Salish | 0.0 /100 | #338 | Tragic 1.2% |
| Immigrants | Central America | 0.0 /100 | #339 | Tragic 1.2% |
| Immigrants | Cuba | 0.0 /100 | #340 | Tragic 1.2% |
| Mexicans | 0.0 /100 | #341 | Tragic 1.2% |
| Arapaho | 0.0 /100 | #342 | Tragic 1.2% |
| Fijians | 0.0 /100 | #343 | Tragic 1.1% |
| Immigrants | Mexico | 0.0 /100 | #344 | Tragic 1.1% |
| Lumbee | 0.0 /100 | #345 | Tragic 1.1% |
| Spanish American Indians | 0.0 /100 | #346 | Tragic 1.1% |
| Houma | 0.0 /100 | #347 | Tragic 0.96% |
Demographics Similar to Immigrants from Uganda by Doctorate Degree
In terms of doctorate degree, the demographic groups most similar to Immigrants from Uganda are Immigrants from Lithuania (2.2%, a difference of 0.17%), Immigrants from England (2.2%, a difference of 0.32%), Immigrants from Brazil (2.2%, a difference of 0.45%), Immigrants from Argentina (2.2%, a difference of 0.54%), and Ugandan (2.2%, a difference of 0.59%).
| Demographics | Rating | Rank | Doctorate Degree |
| Immigrants | Western Asia | 99.8 /100 | #75 | Exceptional 2.2% |
| Immigrants | Hungary | 99.8 /100 | #76 | Exceptional 2.2% |
| Immigrants | Lebanon | 99.8 /100 | #77 | Exceptional 2.2% |
| Immigrants | Belarus | 99.7 /100 | #78 | Exceptional 2.2% |
| Northern Europeans | 99.7 /100 | #79 | Exceptional 2.2% |
| Ugandans | 99.7 /100 | #80 | Exceptional 2.2% |
| Immigrants | Argentina | 99.7 /100 | #81 | Exceptional 2.2% |
| Immigrants | Uganda | 99.6 /100 | #82 | Exceptional 2.2% |
| Immigrants | Lithuania | 99.6 /100 | #83 | Exceptional 2.2% |
| Immigrants | England | 99.6 /100 | #84 | Exceptional 2.2% |
| Immigrants | Brazil | 99.6 /100 | #85 | Exceptional 2.2% |
| Egyptians | 99.4 /100 | #86 | Exceptional 2.2% |
| Immigrants | Zimbabwe | 99.4 /100 | #87 | Exceptional 2.2% |
| Immigrants | Nepal | 99.3 /100 | #88 | Exceptional 2.2% |
| British | 99.3 /100 | #89 | Exceptional 2.2% |