Paraguayan vs Immigrants from Uganda Doctorate Degree
COMPARE
Paraguayan
Immigrants from Uganda
Doctorate Degree
Doctorate Degree Comparison
Paraguayans
Immigrants from Uganda
2.3%
DOCTORATE DEGREE
99.9/ 100
METRIC RATING
65th/ 347
METRIC RANK
2.2%
DOCTORATE DEGREE
99.6/ 100
METRIC RATING
82nd/ 347
METRIC RANK
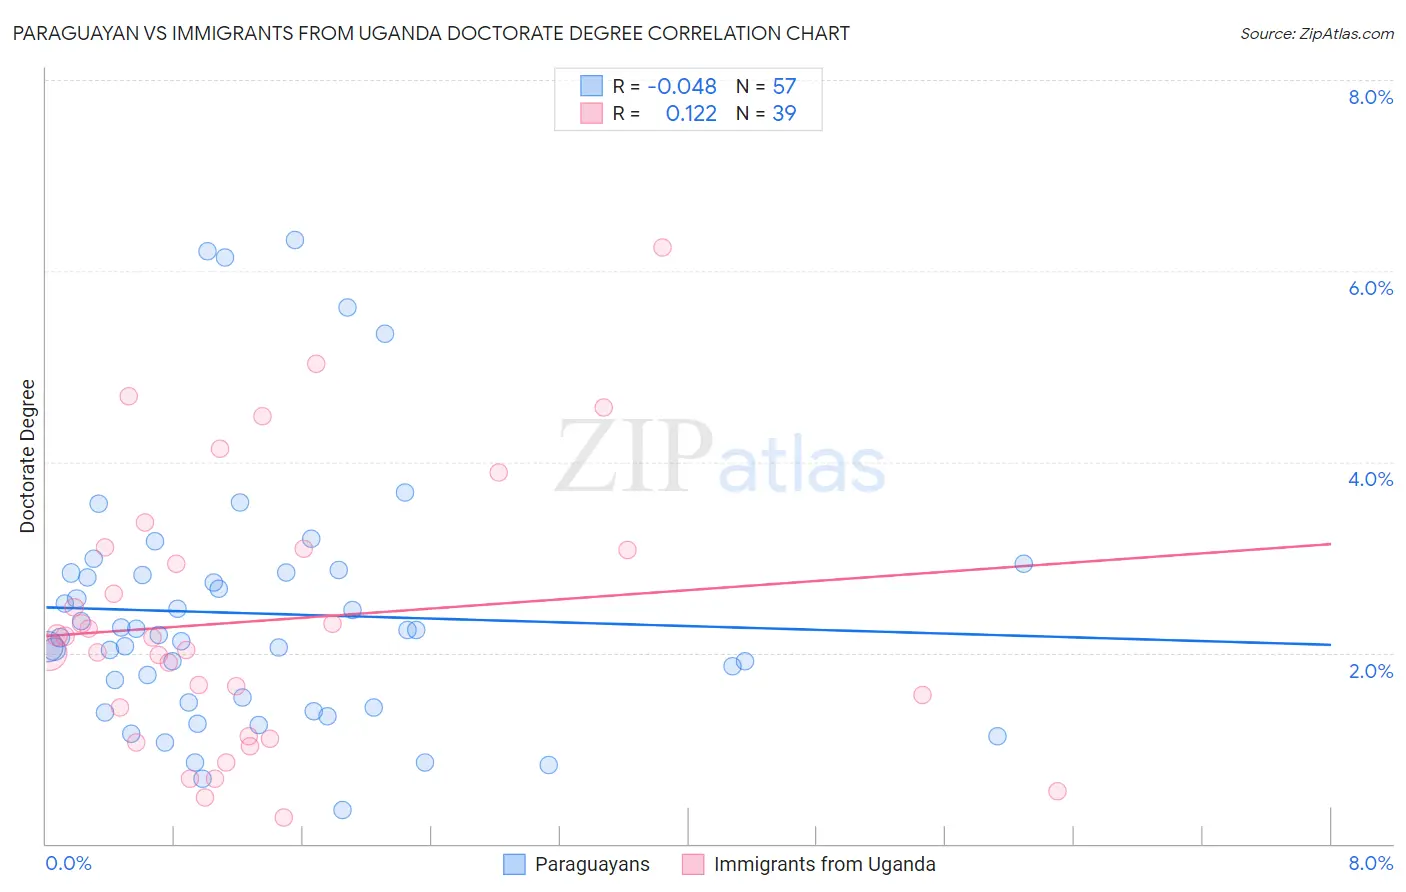
Paraguayan vs Immigrants from Uganda Doctorate Degree Correlation Chart
The statistical analysis conducted on geographies consisting of 94,964,033 people shows no correlation between the proportion of Paraguayans and percentage of population with at least doctorate degree education in the United States with a correlation coefficient (R) of -0.048 and weighted average of 2.3%. Similarly, the statistical analysis conducted on geographies consisting of 125,795,140 people shows a poor positive correlation between the proportion of Immigrants from Uganda and percentage of population with at least doctorate degree education in the United States with a correlation coefficient (R) of 0.122 and weighted average of 2.2%, a difference of 3.3%.
Doctorate Degree Correlation Summary
| Measurement | Paraguayan | Immigrants from Uganda |
| Minimum | 0.35% | 0.28% |
| Maximum | 6.3% | 6.2% |
| Range | 6.0% | 6.0% |
| Mean | 2.4% | 2.3% |
| Median | 2.2% | 2.2% |
| Interquartile 25% (IQ1) | 1.5% | 1.1% |
| Interquartile 75% (IQ3) | 2.8% | 3.1% |
| Interquartile Range (IQR) | 1.4% | 2.0% |
| Standard Deviation (Sample) | 1.3% | 1.4% |
| Standard Deviation (Population) | 1.3% | 1.4% |
Demographics Similar to Paraguayans and Immigrants from Uganda by Doctorate Degree
In terms of doctorate degree, the demographic groups most similar to Paraguayans are Argentinean (2.3%, a difference of 0.17%), Immigrants from Greece (2.3%, a difference of 0.50%), Zimbabwean (2.3%, a difference of 0.63%), Immigrants from Kazakhstan (2.3%, a difference of 0.86%), and Laotian (2.3%, a difference of 0.90%). Similarly, the demographic groups most similar to Immigrants from Uganda are Immigrants from Lithuania (2.2%, a difference of 0.17%), Immigrants from Argentina (2.2%, a difference of 0.54%), Ugandan (2.2%, a difference of 0.59%), Northern European (2.2%, a difference of 0.88%), and Immigrants from Belarus (2.2%, a difference of 0.94%).
| Demographics | Rating | Rank | Doctorate Degree |
| Laotians | 99.9 /100 | #63 | Exceptional 2.3% |
| Immigrants | Greece | 99.9 /100 | #64 | Exceptional 2.3% |
| Paraguayans | 99.9 /100 | #65 | Exceptional 2.3% |
| Argentineans | 99.9 /100 | #66 | Exceptional 2.3% |
| Zimbabweans | 99.8 /100 | #67 | Exceptional 2.3% |
| Immigrants | Kazakhstan | 99.8 /100 | #68 | Exceptional 2.3% |
| Carpatho Rusyns | 99.8 /100 | #69 | Exceptional 2.3% |
| Lithuanians | 99.8 /100 | #70 | Exceptional 2.3% |
| Immigrants | Bolivia | 99.8 /100 | #71 | Exceptional 2.3% |
| Immigrants | Canada | 99.8 /100 | #72 | Exceptional 2.3% |
| Immigrants | Bulgaria | 99.8 /100 | #73 | Exceptional 2.3% |
| Immigrants | North America | 99.8 /100 | #74 | Exceptional 2.2% |
| Immigrants | Western Asia | 99.8 /100 | #75 | Exceptional 2.2% |
| Immigrants | Hungary | 99.8 /100 | #76 | Exceptional 2.2% |
| Immigrants | Lebanon | 99.8 /100 | #77 | Exceptional 2.2% |
| Immigrants | Belarus | 99.7 /100 | #78 | Exceptional 2.2% |
| Northern Europeans | 99.7 /100 | #79 | Exceptional 2.2% |
| Ugandans | 99.7 /100 | #80 | Exceptional 2.2% |
| Immigrants | Argentina | 99.7 /100 | #81 | Exceptional 2.2% |
| Immigrants | Uganda | 99.6 /100 | #82 | Exceptional 2.2% |
| Immigrants | Lithuania | 99.6 /100 | #83 | Exceptional 2.2% |