Immigrants from Iran vs Immigrants from Uganda Doctorate Degree
COMPARE
Immigrants from Iran
Immigrants from Uganda
Doctorate Degree
Doctorate Degree Comparison
Immigrants from Iran
Immigrants from Uganda
3.0%
DOCTORATE DEGREE
100.0/ 100
METRIC RATING
9th/ 347
METRIC RANK
2.2%
DOCTORATE DEGREE
99.6/ 100
METRIC RATING
82nd/ 347
METRIC RANK
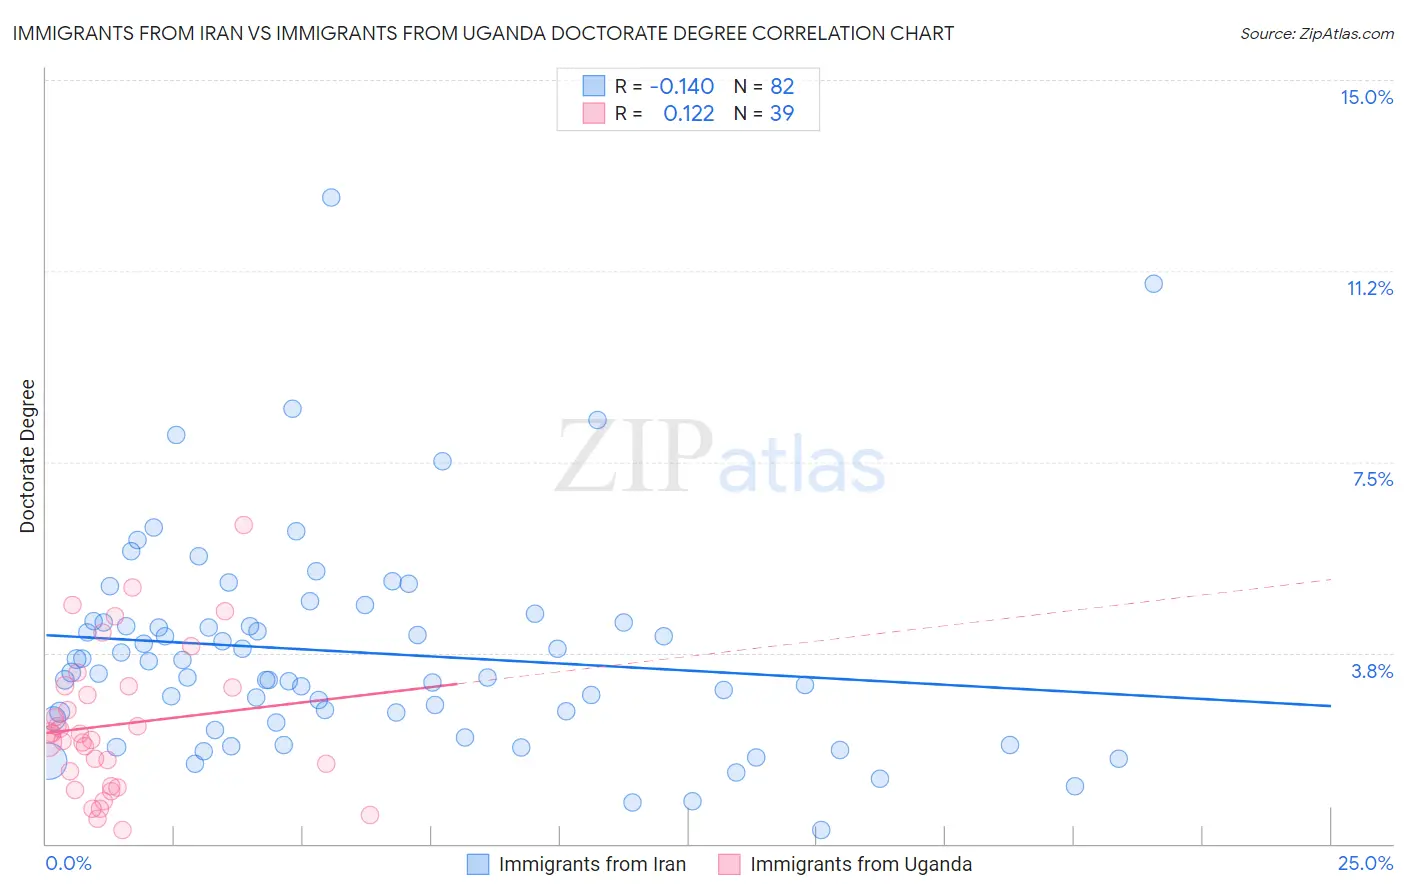
Immigrants from Iran vs Immigrants from Uganda Doctorate Degree Correlation Chart
The statistical analysis conducted on geographies consisting of 279,321,520 people shows a poor negative correlation between the proportion of Immigrants from Iran and percentage of population with at least doctorate degree education in the United States with a correlation coefficient (R) of -0.140 and weighted average of 3.0%. Similarly, the statistical analysis conducted on geographies consisting of 125,795,140 people shows a poor positive correlation between the proportion of Immigrants from Uganda and percentage of population with at least doctorate degree education in the United States with a correlation coefficient (R) of 0.122 and weighted average of 2.2%, a difference of 36.8%.
Doctorate Degree Correlation Summary
| Measurement | Immigrants from Iran | Immigrants from Uganda |
| Minimum | 0.26% | 0.28% |
| Maximum | 12.7% | 6.2% |
| Range | 12.4% | 6.0% |
| Mean | 3.8% | 2.3% |
| Median | 3.4% | 2.2% |
| Interquartile 25% (IQ1) | 2.5% | 1.1% |
| Interquartile 75% (IQ3) | 4.4% | 3.1% |
| Interquartile Range (IQR) | 1.9% | 2.0% |
| Standard Deviation (Sample) | 2.1% | 1.4% |
| Standard Deviation (Population) | 2.1% | 1.4% |
Similar Demographics by Doctorate Degree
Demographics Similar to Immigrants from Iran by Doctorate Degree
In terms of doctorate degree, the demographic groups most similar to Immigrants from Iran are Immigrants from Israel (3.0%, a difference of 0.67%), Immigrants from China (3.1%, a difference of 2.0%), Immigrants from Switzerland (3.1%, a difference of 2.1%), Immigrants from Eastern Asia (3.0%, a difference of 2.1%), and Iranian (3.1%, a difference of 4.0%).
| Demographics | Rating | Rank | Doctorate Degree |
| Filipinos | 100.0 /100 | #2 | Exceptional 3.4% |
| Okinawans | 100.0 /100 | #3 | Exceptional 3.3% |
| Immigrants | Taiwan | 100.0 /100 | #4 | Exceptional 3.2% |
| Iranians | 100.0 /100 | #5 | Exceptional 3.1% |
| Immigrants | Switzerland | 100.0 /100 | #6 | Exceptional 3.1% |
| Immigrants | China | 100.0 /100 | #7 | Exceptional 3.1% |
| Immigrants | Israel | 100.0 /100 | #8 | Exceptional 3.0% |
| Immigrants | Iran | 100.0 /100 | #9 | Exceptional 3.0% |
| Immigrants | Eastern Asia | 100.0 /100 | #10 | Exceptional 3.0% |
| Indians (Asian) | 100.0 /100 | #11 | Exceptional 2.9% |
| Immigrants | Belgium | 100.0 /100 | #12 | Exceptional 2.9% |
| Immigrants | Sweden | 100.0 /100 | #13 | Exceptional 2.9% |
| Immigrants | France | 100.0 /100 | #14 | Exceptional 2.9% |
| Immigrants | India | 100.0 /100 | #15 | Exceptional 2.8% |
| Eastern Europeans | 100.0 /100 | #16 | Exceptional 2.8% |
Demographics Similar to Immigrants from Uganda by Doctorate Degree
In terms of doctorate degree, the demographic groups most similar to Immigrants from Uganda are Immigrants from Lithuania (2.2%, a difference of 0.17%), Immigrants from England (2.2%, a difference of 0.32%), Immigrants from Brazil (2.2%, a difference of 0.45%), Immigrants from Argentina (2.2%, a difference of 0.54%), and Ugandan (2.2%, a difference of 0.59%).
| Demographics | Rating | Rank | Doctorate Degree |
| Immigrants | Western Asia | 99.8 /100 | #75 | Exceptional 2.2% |
| Immigrants | Hungary | 99.8 /100 | #76 | Exceptional 2.2% |
| Immigrants | Lebanon | 99.8 /100 | #77 | Exceptional 2.2% |
| Immigrants | Belarus | 99.7 /100 | #78 | Exceptional 2.2% |
| Northern Europeans | 99.7 /100 | #79 | Exceptional 2.2% |
| Ugandans | 99.7 /100 | #80 | Exceptional 2.2% |
| Immigrants | Argentina | 99.7 /100 | #81 | Exceptional 2.2% |
| Immigrants | Uganda | 99.6 /100 | #82 | Exceptional 2.2% |
| Immigrants | Lithuania | 99.6 /100 | #83 | Exceptional 2.2% |
| Immigrants | England | 99.6 /100 | #84 | Exceptional 2.2% |
| Immigrants | Brazil | 99.6 /100 | #85 | Exceptional 2.2% |
| Egyptians | 99.4 /100 | #86 | Exceptional 2.2% |
| Immigrants | Zimbabwe | 99.4 /100 | #87 | Exceptional 2.2% |
| Immigrants | Nepal | 99.3 /100 | #88 | Exceptional 2.2% |
| British | 99.3 /100 | #89 | Exceptional 2.2% |