Spanish American Indian vs Immigrants from Sudan 8th Grade
COMPARE
Spanish American Indian
Immigrants from Sudan
8th Grade
8th Grade Comparison
Spanish American Indians
Immigrants from Sudan
89.8%
8TH GRADE
0.0/ 100
METRIC RATING
347th/ 347
METRIC RANK
95.5%
8TH GRADE
15.1/ 100
METRIC RATING
207th/ 347
METRIC RANK
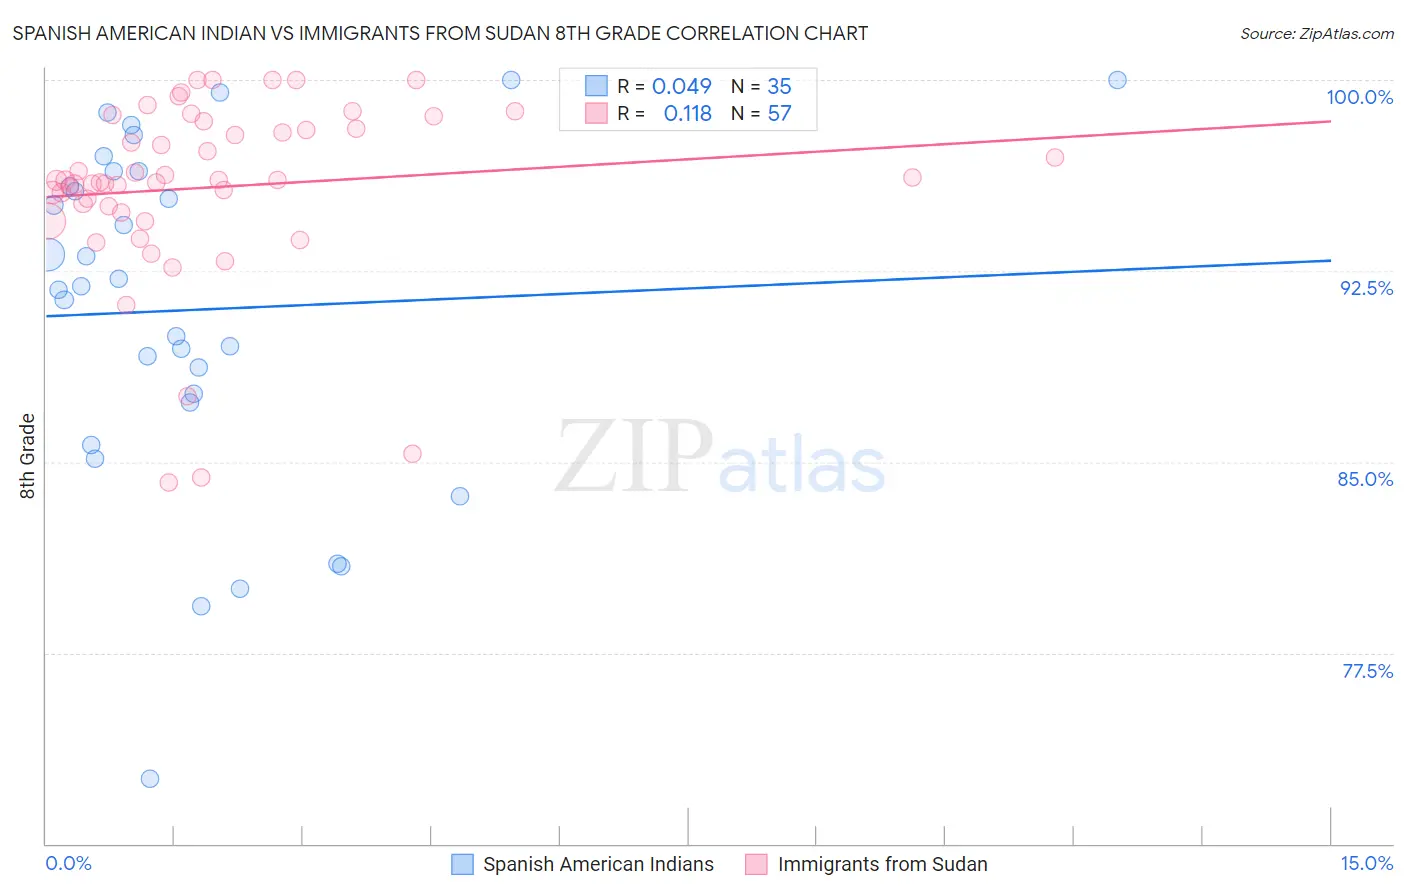
Spanish American Indian vs Immigrants from Sudan 8th Grade Correlation Chart
The statistical analysis conducted on geographies consisting of 73,150,359 people shows no correlation between the proportion of Spanish American Indians and percentage of population with at least 8th grade education in the United States with a correlation coefficient (R) of 0.049 and weighted average of 89.8%. Similarly, the statistical analysis conducted on geographies consisting of 118,959,807 people shows a poor positive correlation between the proportion of Immigrants from Sudan and percentage of population with at least 8th grade education in the United States with a correlation coefficient (R) of 0.118 and weighted average of 95.5%, a difference of 6.4%.
8th Grade Correlation Summary
| Measurement | Spanish American Indian | Immigrants from Sudan |
| Minimum | 72.6% | 84.2% |
| Maximum | 100.0% | 100.0% |
| Range | 27.4% | 15.8% |
| Mean | 91.0% | 95.8% |
| Median | 91.9% | 96.1% |
| Interquartile 25% (IQ1) | 87.3% | 94.9% |
| Interquartile 75% (IQ3) | 96.4% | 98.2% |
| Interquartile Range (IQR) | 9.1% | 3.3% |
| Standard Deviation (Sample) | 6.7% | 3.6% |
| Standard Deviation (Population) | 6.6% | 3.5% |
Similar Demographics by 8th Grade
Demographics Similar to Spanish American Indians by 8th Grade
In terms of 8th grade, the demographic groups most similar to Spanish American Indians are Immigrants from Mexico (90.2%, a difference of 0.44%), Immigrants from El Salvador (90.3%, a difference of 0.62%), Immigrants from Central America (90.4%, a difference of 0.71%), Immigrants from Guatemala (90.7%, a difference of 1.1%), and Salvadoran (90.9%, a difference of 1.3%).
| Demographics | Rating | Rank | 8th Grade |
| Hispanics or Latinos | 0.0 /100 | #333 | Tragic 92.2% |
| Immigrants | Yemen | 0.0 /100 | #334 | Tragic 92.1% |
| Mexican American Indians | 0.0 /100 | #335 | Tragic 92.1% |
| Immigrants | Honduras | 0.0 /100 | #336 | Tragic 91.9% |
| Immigrants | Latin America | 0.0 /100 | #337 | Tragic 91.7% |
| Central Americans | 0.0 /100 | #338 | Tragic 91.6% |
| Mexicans | 0.0 /100 | #339 | Tragic 91.4% |
| Yakama | 0.0 /100 | #340 | Tragic 91.2% |
| Guatemalans | 0.0 /100 | #341 | Tragic 91.1% |
| Salvadorans | 0.0 /100 | #342 | Tragic 90.9% |
| Immigrants | Guatemala | 0.0 /100 | #343 | Tragic 90.7% |
| Immigrants | Central America | 0.0 /100 | #344 | Tragic 90.4% |
| Immigrants | El Salvador | 0.0 /100 | #345 | Tragic 90.3% |
| Immigrants | Mexico | 0.0 /100 | #346 | Tragic 90.2% |
| Spanish American Indians | 0.0 /100 | #347 | Tragic 89.8% |
Demographics Similar to Immigrants from Sudan by 8th Grade
In terms of 8th grade, the demographic groups most similar to Immigrants from Sudan are Portuguese (95.5%, a difference of 0.010%), Hawaiian (95.5%, a difference of 0.020%), Immigrants from Bahamas (95.5%, a difference of 0.020%), Comanche (95.5%, a difference of 0.020%), and Immigrants from Lebanon (95.4%, a difference of 0.020%).
| Demographics | Rating | Rank | 8th Grade |
| Argentineans | 22.2 /100 | #200 | Fair 95.5% |
| Immigrants | Argentina | 20.6 /100 | #201 | Fair 95.5% |
| Apache | 19.4 /100 | #202 | Poor 95.5% |
| Moroccans | 17.4 /100 | #203 | Poor 95.5% |
| Hawaiians | 16.7 /100 | #204 | Poor 95.5% |
| Immigrants | Bahamas | 16.7 /100 | #205 | Poor 95.5% |
| Comanche | 16.3 /100 | #206 | Poor 95.5% |
| Immigrants | Sudan | 15.1 /100 | #207 | Poor 95.5% |
| Portuguese | 14.3 /100 | #208 | Poor 95.5% |
| Immigrants | Lebanon | 13.7 /100 | #209 | Poor 95.4% |
| Africans | 13.6 /100 | #210 | Poor 95.4% |
| Immigrants | Morocco | 12.4 /100 | #211 | Poor 95.4% |
| Immigrants | Pakistan | 9.7 /100 | #212 | Tragic 95.4% |
| Laotians | 9.0 /100 | #213 | Tragic 95.4% |
| Immigrants | Chile | 9.0 /100 | #214 | Tragic 95.4% |