Immigrants from Oceania vs Immigrants from Sudan 8th Grade
COMPARE
Immigrants from Oceania
Immigrants from Sudan
8th Grade
8th Grade Comparison
Immigrants from Oceania
Immigrants from Sudan
95.3%
8TH GRADE
7.1/ 100
METRIC RATING
223rd/ 347
METRIC RANK
95.5%
8TH GRADE
15.1/ 100
METRIC RATING
207th/ 347
METRIC RANK
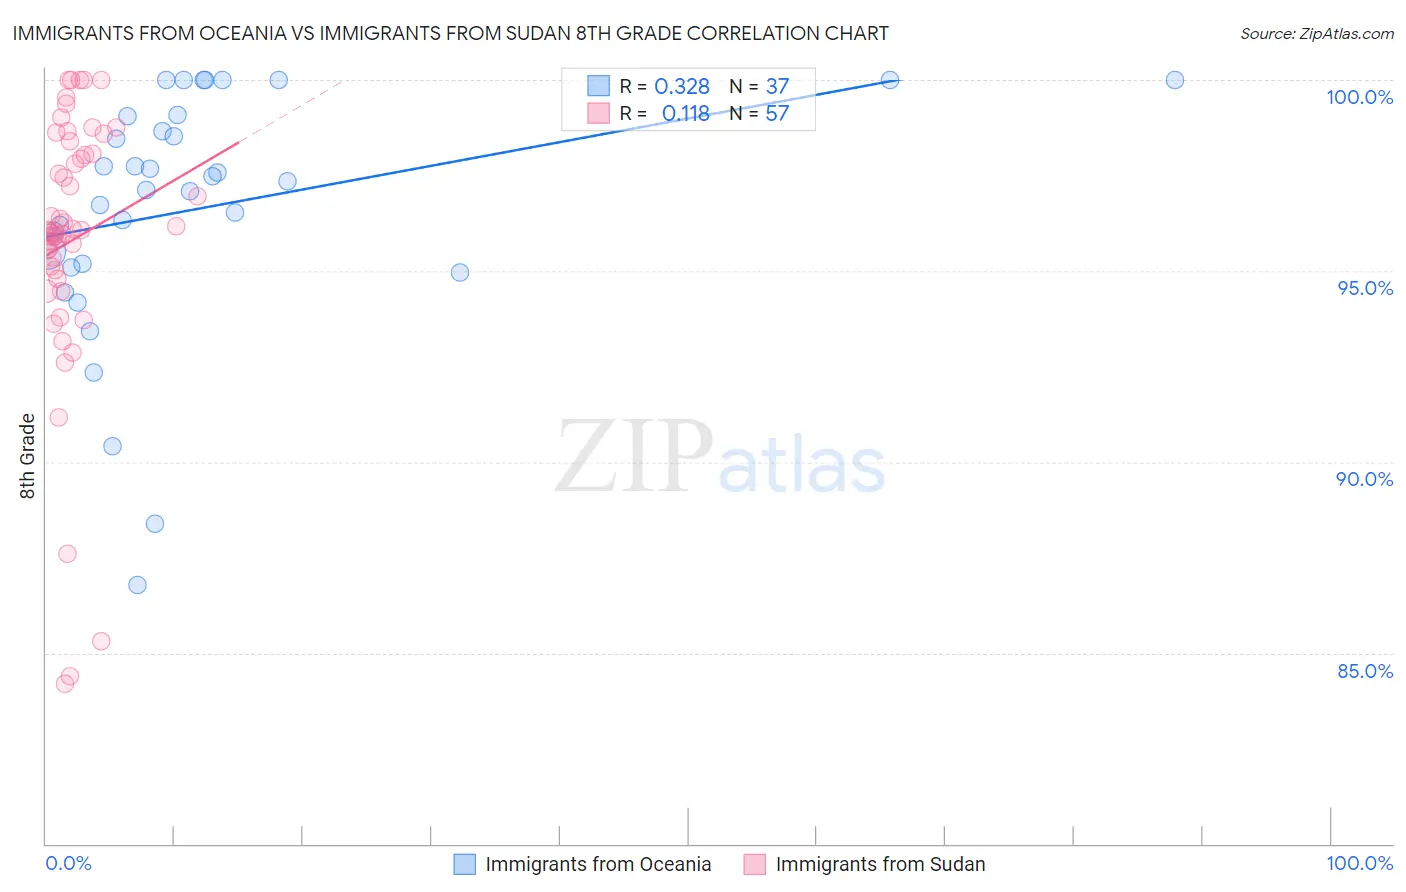
Immigrants from Oceania vs Immigrants from Sudan 8th Grade Correlation Chart
The statistical analysis conducted on geographies consisting of 305,521,521 people shows a mild positive correlation between the proportion of Immigrants from Oceania and percentage of population with at least 8th grade education in the United States with a correlation coefficient (R) of 0.328 and weighted average of 95.3%. Similarly, the statistical analysis conducted on geographies consisting of 118,959,807 people shows a poor positive correlation between the proportion of Immigrants from Sudan and percentage of population with at least 8th grade education in the United States with a correlation coefficient (R) of 0.118 and weighted average of 95.5%, a difference of 0.14%.
8th Grade Correlation Summary
| Measurement | Immigrants from Oceania | Immigrants from Sudan |
| Minimum | 86.8% | 84.2% |
| Maximum | 100.0% | 100.0% |
| Range | 13.2% | 15.8% |
| Mean | 96.6% | 95.8% |
| Median | 97.3% | 96.1% |
| Interquartile 25% (IQ1) | 95.1% | 94.9% |
| Interquartile 75% (IQ3) | 99.1% | 98.2% |
| Interquartile Range (IQR) | 3.9% | 3.3% |
| Standard Deviation (Sample) | 3.2% | 3.6% |
| Standard Deviation (Population) | 3.2% | 3.5% |
Demographics Similar to Immigrants from Oceania and Immigrants from Sudan by 8th Grade
In terms of 8th grade, the demographic groups most similar to Immigrants from Oceania are Immigrants from Malaysia (95.3%, a difference of 0.0%), Immigrants from Southern Europe (95.3%, a difference of 0.010%), Immigrants from Syria (95.3%, a difference of 0.010%), Dutch West Indian (95.4%, a difference of 0.020%), and Spanish American (95.4%, a difference of 0.020%). Similarly, the demographic groups most similar to Immigrants from Sudan are Portuguese (95.5%, a difference of 0.010%), Immigrants from Bahamas (95.5%, a difference of 0.020%), Comanche (95.5%, a difference of 0.020%), Immigrants from Lebanon (95.4%, a difference of 0.020%), and African (95.4%, a difference of 0.020%).
| Demographics | Rating | Rank | 8th Grade |
| Immigrants | Bahamas | 16.7 /100 | #205 | Poor 95.5% |
| Comanche | 16.3 /100 | #206 | Poor 95.5% |
| Immigrants | Sudan | 15.1 /100 | #207 | Poor 95.5% |
| Portuguese | 14.3 /100 | #208 | Poor 95.5% |
| Immigrants | Lebanon | 13.7 /100 | #209 | Poor 95.4% |
| Africans | 13.6 /100 | #210 | Poor 95.4% |
| Immigrants | Morocco | 12.4 /100 | #211 | Poor 95.4% |
| Immigrants | Pakistan | 9.7 /100 | #212 | Tragic 95.4% |
| Laotians | 9.0 /100 | #213 | Tragic 95.4% |
| Immigrants | Chile | 9.0 /100 | #214 | Tragic 95.4% |
| Immigrants | Liberia | 8.9 /100 | #215 | Tragic 95.4% |
| Samoans | 8.4 /100 | #216 | Tragic 95.4% |
| Immigrants | Eastern Asia | 8.3 /100 | #217 | Tragic 95.4% |
| Dutch West Indians | 8.1 /100 | #218 | Tragic 95.4% |
| Spanish Americans | 8.0 /100 | #219 | Tragic 95.4% |
| Immigrants | Southern Europe | 7.7 /100 | #220 | Tragic 95.3% |
| Immigrants | Syria | 7.4 /100 | #221 | Tragic 95.3% |
| Immigrants | Malaysia | 7.3 /100 | #222 | Tragic 95.3% |
| Immigrants | Oceania | 7.1 /100 | #223 | Tragic 95.3% |
| Immigrants | Western Asia | 6.0 /100 | #224 | Tragic 95.3% |
| Sub-Saharan Africans | 6.0 /100 | #225 | Tragic 95.3% |