Spanish American Indian vs Immigrants from Serbia 8th Grade
COMPARE
Spanish American Indian
Immigrants from Serbia
8th Grade
8th Grade Comparison
Spanish American Indians
Immigrants from Serbia
89.8%
8TH GRADE
0.0/ 100
METRIC RATING
347th/ 347
METRIC RANK
96.2%
8TH GRADE
94.0/ 100
METRIC RATING
127th/ 347
METRIC RANK
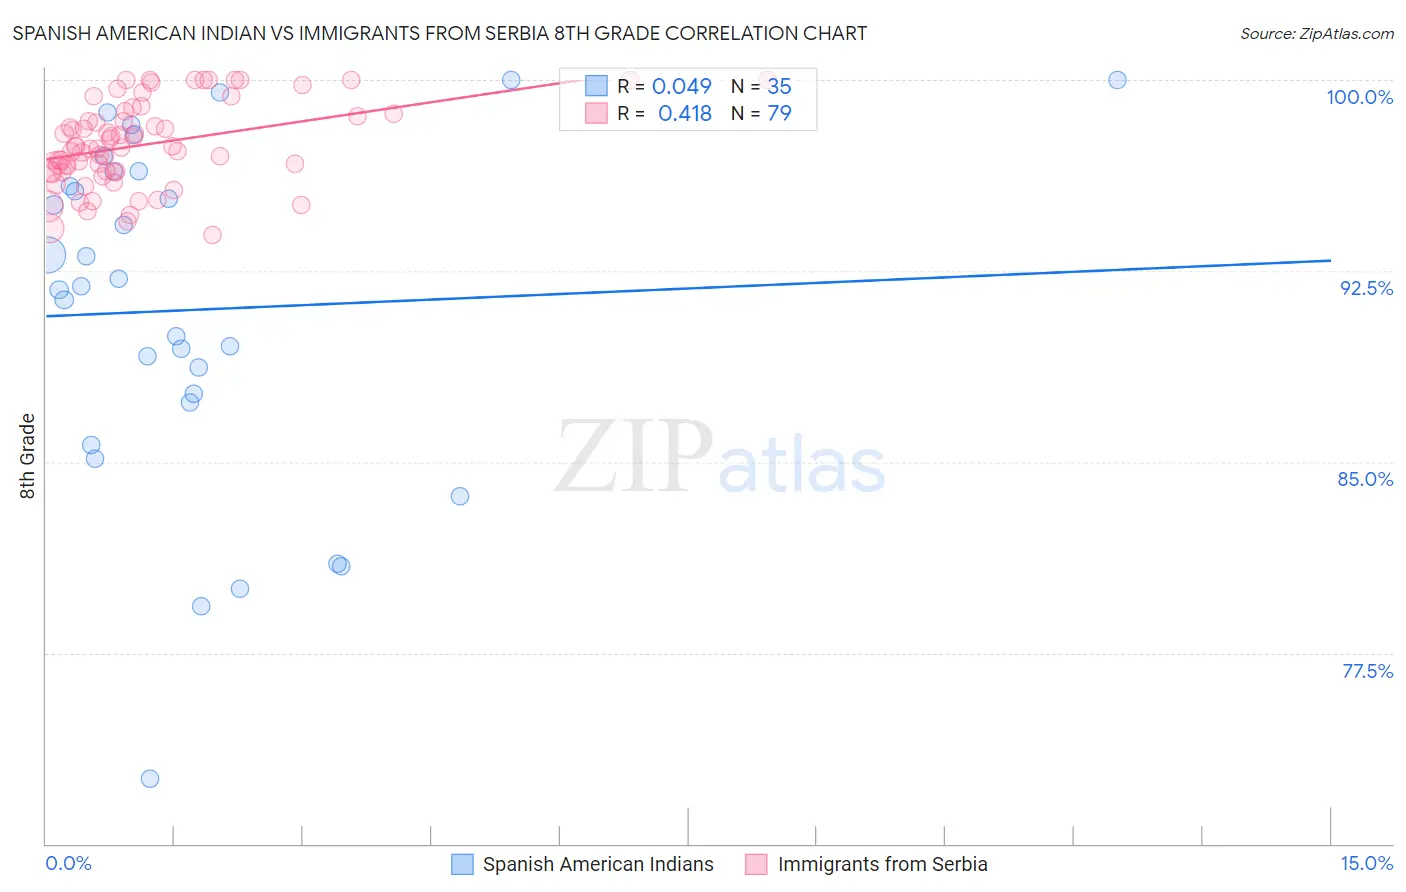
Spanish American Indian vs Immigrants from Serbia 8th Grade Correlation Chart
The statistical analysis conducted on geographies consisting of 73,150,359 people shows no correlation between the proportion of Spanish American Indians and percentage of population with at least 8th grade education in the United States with a correlation coefficient (R) of 0.049 and weighted average of 89.8%. Similarly, the statistical analysis conducted on geographies consisting of 131,729,423 people shows a moderate positive correlation between the proportion of Immigrants from Serbia and percentage of population with at least 8th grade education in the United States with a correlation coefficient (R) of 0.418 and weighted average of 96.2%, a difference of 7.1%.
8th Grade Correlation Summary
| Measurement | Spanish American Indian | Immigrants from Serbia |
| Minimum | 72.6% | 93.9% |
| Maximum | 100.0% | 100.0% |
| Range | 27.4% | 6.1% |
| Mean | 91.0% | 97.5% |
| Median | 91.9% | 97.3% |
| Interquartile 25% (IQ1) | 87.3% | 96.4% |
| Interquartile 75% (IQ3) | 96.4% | 98.7% |
| Interquartile Range (IQR) | 9.1% | 2.3% |
| Standard Deviation (Sample) | 6.7% | 1.6% |
| Standard Deviation (Population) | 6.6% | 1.6% |
Similar Demographics by 8th Grade
Demographics Similar to Spanish American Indians by 8th Grade
In terms of 8th grade, the demographic groups most similar to Spanish American Indians are Immigrants from Mexico (90.2%, a difference of 0.44%), Immigrants from El Salvador (90.3%, a difference of 0.62%), Immigrants from Central America (90.4%, a difference of 0.71%), Immigrants from Guatemala (90.7%, a difference of 1.1%), and Salvadoran (90.9%, a difference of 1.3%).
| Demographics | Rating | Rank | 8th Grade |
| Hispanics or Latinos | 0.0 /100 | #333 | Tragic 92.2% |
| Immigrants | Yemen | 0.0 /100 | #334 | Tragic 92.1% |
| Mexican American Indians | 0.0 /100 | #335 | Tragic 92.1% |
| Immigrants | Honduras | 0.0 /100 | #336 | Tragic 91.9% |
| Immigrants | Latin America | 0.0 /100 | #337 | Tragic 91.7% |
| Central Americans | 0.0 /100 | #338 | Tragic 91.6% |
| Mexicans | 0.0 /100 | #339 | Tragic 91.4% |
| Yakama | 0.0 /100 | #340 | Tragic 91.2% |
| Guatemalans | 0.0 /100 | #341 | Tragic 91.1% |
| Salvadorans | 0.0 /100 | #342 | Tragic 90.9% |
| Immigrants | Guatemala | 0.0 /100 | #343 | Tragic 90.7% |
| Immigrants | Central America | 0.0 /100 | #344 | Tragic 90.4% |
| Immigrants | El Salvador | 0.0 /100 | #345 | Tragic 90.3% |
| Immigrants | Mexico | 0.0 /100 | #346 | Tragic 90.2% |
| Spanish American Indians | 0.0 /100 | #347 | Tragic 89.8% |
Demographics Similar to Immigrants from Serbia by 8th Grade
In terms of 8th grade, the demographic groups most similar to Immigrants from Serbia are Immigrants from Romania (96.2%, a difference of 0.0%), Choctaw (96.2%, a difference of 0.0%), Immigrants from Bosnia and Herzegovina (96.2%, a difference of 0.0%), Filipino (96.2%, a difference of 0.020%), and Palestinian (96.2%, a difference of 0.020%).
| Demographics | Rating | Rank | 8th Grade |
| Immigrants | France | 95.3 /100 | #120 | Exceptional 96.2% |
| Immigrants | Bulgaria | 95.3 /100 | #121 | Exceptional 96.2% |
| Immigrants | Europe | 95.3 /100 | #122 | Exceptional 96.2% |
| Filipinos | 94.6 /100 | #123 | Exceptional 96.2% |
| Palestinians | 94.6 /100 | #124 | Exceptional 96.2% |
| Immigrants | Romania | 94.1 /100 | #125 | Exceptional 96.2% |
| Choctaw | 94.0 /100 | #126 | Exceptional 96.2% |
| Immigrants | Serbia | 94.0 /100 | #127 | Exceptional 96.2% |
| Immigrants | Bosnia and Herzegovina | 93.9 /100 | #128 | Exceptional 96.2% |
| Cheyenne | 93.3 /100 | #129 | Exceptional 96.1% |
| Soviet Union | 92.6 /100 | #130 | Exceptional 96.1% |
| Pueblo | 92.3 /100 | #131 | Exceptional 96.1% |
| Immigrants | Kuwait | 92.2 /100 | #132 | Exceptional 96.1% |
| Immigrants | Turkey | 91.7 /100 | #133 | Exceptional 96.1% |
| Immigrants | Hungary | 91.5 /100 | #134 | Exceptional 96.1% |