Soviet Union vs Russian Bachelor's Degree
COMPARE
Soviet Union
Russian
Bachelor's Degree
Bachelor's Degree Comparison
Soviet Union
Russians
47.9%
BACHELOR'S DEGREE
100.0/ 100
METRIC RATING
16th/ 347
METRIC RANK
45.3%
BACHELOR'S DEGREE
100.0/ 100
METRIC RATING
37th/ 347
METRIC RANK
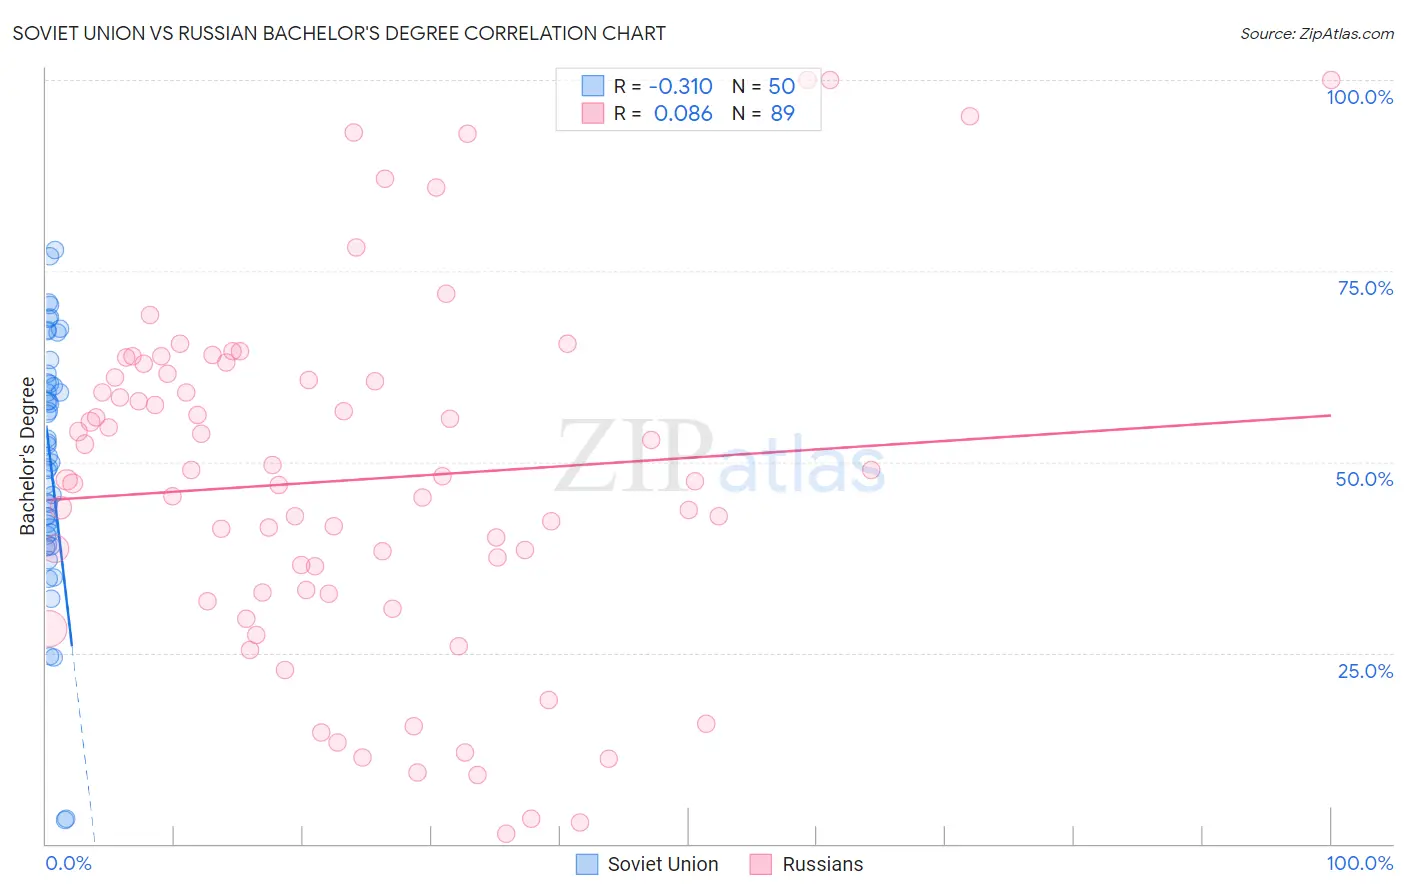
Soviet Union vs Russian Bachelor's Degree Correlation Chart
The statistical analysis conducted on geographies consisting of 43,514,626 people shows a mild negative correlation between the proportion of Soviet Union and percentage of population with at least bachelor's degree education in the United States with a correlation coefficient (R) of -0.310 and weighted average of 47.9%. Similarly, the statistical analysis conducted on geographies consisting of 512,185,650 people shows a slight positive correlation between the proportion of Russians and percentage of population with at least bachelor's degree education in the United States with a correlation coefficient (R) of 0.086 and weighted average of 45.3%, a difference of 5.7%.
Bachelor's Degree Correlation Summary
| Measurement | Soviet Union | Russian |
| Minimum | 3.1% | 1.3% |
| Maximum | 77.7% | 100.0% |
| Range | 74.6% | 98.7% |
| Mean | 50.2% | 47.6% |
| Median | 51.5% | 47.6% |
| Interquartile 25% (IQ1) | 40.7% | 32.8% |
| Interquartile 75% (IQ3) | 60.5% | 61.3% |
| Interquartile Range (IQR) | 19.8% | 28.5% |
| Standard Deviation (Sample) | 16.2% | 23.1% |
| Standard Deviation (Population) | 16.0% | 23.0% |
Similar Demographics by Bachelor's Degree
Demographics Similar to Soviet Union by Bachelor's Degree
In terms of bachelor's degree, the demographic groups most similar to Soviet Union are Immigrants from Eastern Asia (48.1%, a difference of 0.46%), Immigrants from Hong Kong (48.2%, a difference of 0.60%), Eastern European (47.5%, a difference of 0.86%), Immigrants from South Central Asia (48.3%, a difference of 0.88%), and Indian (Asian) (47.4%, a difference of 1.0%).
| Demographics | Rating | Rank | Bachelor's Degree |
| Immigrants | Israel | 100.0 /100 | #9 | Exceptional 50.0% |
| Cypriots | 100.0 /100 | #10 | Exceptional 49.0% |
| Immigrants | Australia | 100.0 /100 | #11 | Exceptional 48.5% |
| Immigrants | China | 100.0 /100 | #12 | Exceptional 48.4% |
| Immigrants | South Central Asia | 100.0 /100 | #13 | Exceptional 48.3% |
| Immigrants | Hong Kong | 100.0 /100 | #14 | Exceptional 48.2% |
| Immigrants | Eastern Asia | 100.0 /100 | #15 | Exceptional 48.1% |
| Soviet Union | 100.0 /100 | #16 | Exceptional 47.9% |
| Eastern Europeans | 100.0 /100 | #17 | Exceptional 47.5% |
| Indians (Asian) | 100.0 /100 | #18 | Exceptional 47.4% |
| Cambodians | 100.0 /100 | #19 | Exceptional 47.2% |
| Immigrants | Switzerland | 100.0 /100 | #20 | Exceptional 47.1% |
| Immigrants | Ireland | 100.0 /100 | #21 | Exceptional 47.1% |
| Immigrants | Belgium | 100.0 /100 | #22 | Exceptional 47.0% |
| Immigrants | Sweden | 100.0 /100 | #23 | Exceptional 47.0% |
Demographics Similar to Russians by Bachelor's Degree
In terms of bachelor's degree, the demographic groups most similar to Russians are Bulgarian (45.3%, a difference of 0.090%), Mongolian (45.4%, a difference of 0.15%), Immigrants from Russia (45.4%, a difference of 0.17%), Immigrants from Denmark (45.4%, a difference of 0.19%), and Immigrants from Latvia (45.1%, a difference of 0.42%).
| Demographics | Rating | Rank | Bachelor's Degree |
| Immigrants | Sri Lanka | 100.0 /100 | #30 | Exceptional 46.1% |
| Latvians | 100.0 /100 | #31 | Exceptional 46.1% |
| Immigrants | Turkey | 100.0 /100 | #32 | Exceptional 46.0% |
| Immigrants | Northern Europe | 100.0 /100 | #33 | Exceptional 45.6% |
| Immigrants | Denmark | 100.0 /100 | #34 | Exceptional 45.4% |
| Immigrants | Russia | 100.0 /100 | #35 | Exceptional 45.4% |
| Mongolians | 100.0 /100 | #36 | Exceptional 45.4% |
| Russians | 100.0 /100 | #37 | Exceptional 45.3% |
| Bulgarians | 100.0 /100 | #38 | Exceptional 45.3% |
| Immigrants | Latvia | 100.0 /100 | #39 | Exceptional 45.1% |
| Immigrants | Belarus | 100.0 /100 | #40 | Exceptional 45.0% |
| Immigrants | Malaysia | 100.0 /100 | #41 | Exceptional 45.0% |
| Immigrants | Saudi Arabia | 100.0 /100 | #42 | Exceptional 44.8% |
| Immigrants | South Africa | 99.9 /100 | #43 | Exceptional 44.8% |
| Immigrants | Lithuania | 99.9 /100 | #44 | Exceptional 44.6% |