Immigrants from Taiwan vs Russian Bachelor's Degree
COMPARE
Immigrants from Taiwan
Russian
Bachelor's Degree
Bachelor's Degree Comparison
Immigrants from Taiwan
Russians
51.2%
BACHELOR'S DEGREE
100.0/ 100
METRIC RATING
4th/ 347
METRIC RANK
45.3%
BACHELOR'S DEGREE
100.0/ 100
METRIC RATING
37th/ 347
METRIC RANK
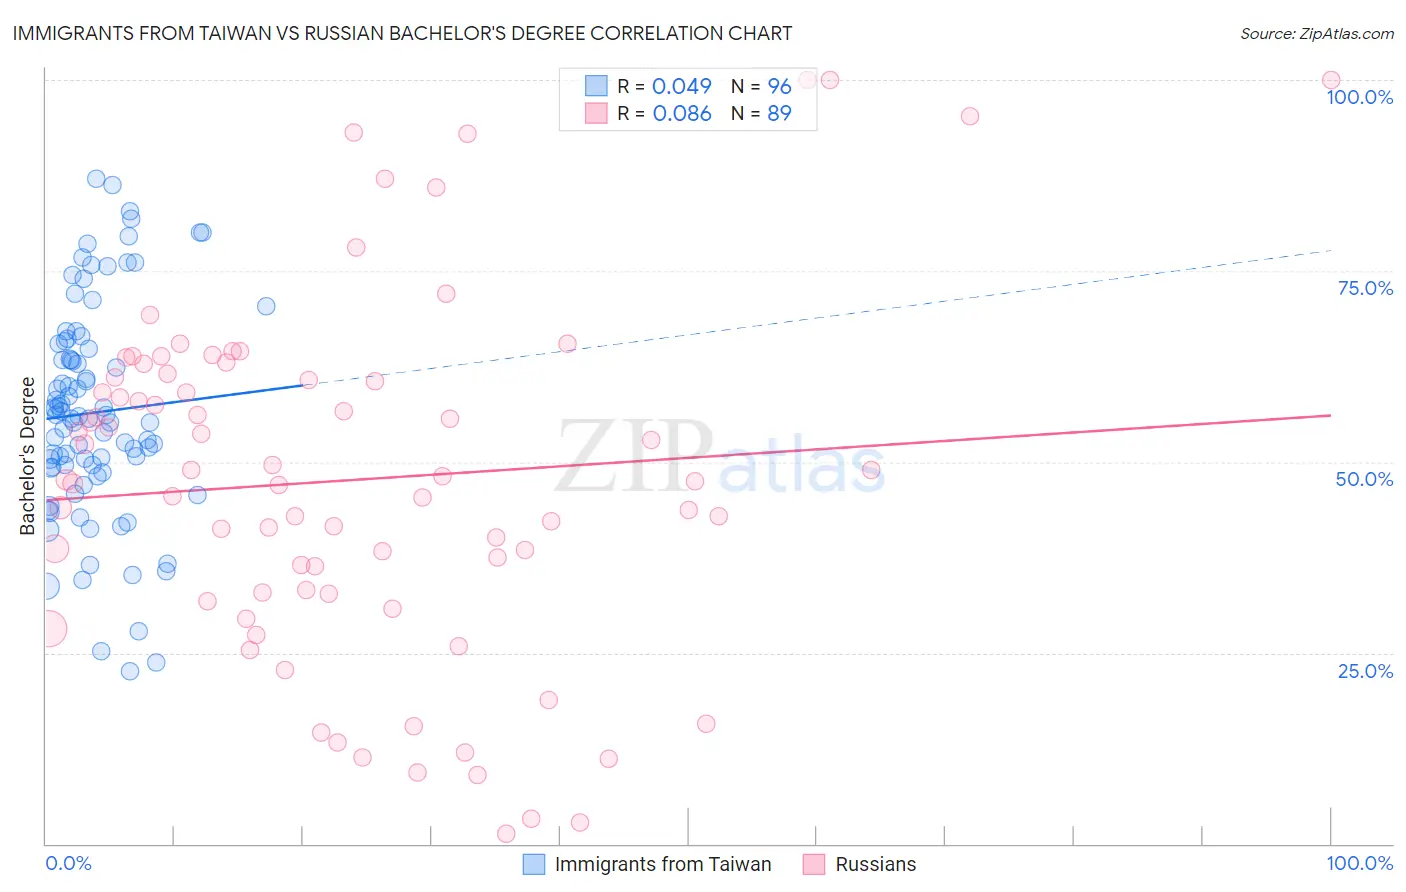
Immigrants from Taiwan vs Russian Bachelor's Degree Correlation Chart
The statistical analysis conducted on geographies consisting of 298,272,482 people shows no correlation between the proportion of Immigrants from Taiwan and percentage of population with at least bachelor's degree education in the United States with a correlation coefficient (R) of 0.049 and weighted average of 51.2%. Similarly, the statistical analysis conducted on geographies consisting of 512,185,650 people shows a slight positive correlation between the proportion of Russians and percentage of population with at least bachelor's degree education in the United States with a correlation coefficient (R) of 0.086 and weighted average of 45.3%, a difference of 12.9%.
Bachelor's Degree Correlation Summary
| Measurement | Immigrants from Taiwan | Russian |
| Minimum | 22.6% | 1.3% |
| Maximum | 87.1% | 100.0% |
| Range | 64.5% | 98.7% |
| Mean | 56.5% | 47.6% |
| Median | 55.9% | 47.6% |
| Interquartile 25% (IQ1) | 49.3% | 32.8% |
| Interquartile 75% (IQ3) | 65.1% | 61.3% |
| Interquartile Range (IQR) | 15.9% | 28.5% |
| Standard Deviation (Sample) | 14.1% | 23.1% |
| Standard Deviation (Population) | 14.0% | 23.0% |
Similar Demographics by Bachelor's Degree
Demographics Similar to Immigrants from Taiwan by Bachelor's Degree
In terms of bachelor's degree, the demographic groups most similar to Immigrants from Taiwan are Immigrants from India (51.3%, a difference of 0.21%), Iranian (51.0%, a difference of 0.42%), Okinawan (50.5%, a difference of 1.3%), Immigrants from Singapore (51.9%, a difference of 1.4%), and Immigrants from Iran (50.3%, a difference of 1.7%).
| Demographics | Rating | Rank | Bachelor's Degree |
| Filipinos | 100.0 /100 | #1 | Exceptional 52.7% |
| Immigrants | Singapore | 100.0 /100 | #2 | Exceptional 51.9% |
| Immigrants | India | 100.0 /100 | #3 | Exceptional 51.3% |
| Immigrants | Taiwan | 100.0 /100 | #4 | Exceptional 51.2% |
| Iranians | 100.0 /100 | #5 | Exceptional 51.0% |
| Okinawans | 100.0 /100 | #6 | Exceptional 50.5% |
| Immigrants | Iran | 100.0 /100 | #7 | Exceptional 50.3% |
| Thais | 100.0 /100 | #8 | Exceptional 50.1% |
| Immigrants | Israel | 100.0 /100 | #9 | Exceptional 50.0% |
| Cypriots | 100.0 /100 | #10 | Exceptional 49.0% |
| Immigrants | Australia | 100.0 /100 | #11 | Exceptional 48.5% |
| Immigrants | China | 100.0 /100 | #12 | Exceptional 48.4% |
| Immigrants | South Central Asia | 100.0 /100 | #13 | Exceptional 48.3% |
| Immigrants | Hong Kong | 100.0 /100 | #14 | Exceptional 48.2% |
| Immigrants | Eastern Asia | 100.0 /100 | #15 | Exceptional 48.1% |
Demographics Similar to Russians by Bachelor's Degree
In terms of bachelor's degree, the demographic groups most similar to Russians are Bulgarian (45.3%, a difference of 0.090%), Mongolian (45.4%, a difference of 0.15%), Immigrants from Russia (45.4%, a difference of 0.17%), Immigrants from Denmark (45.4%, a difference of 0.19%), and Immigrants from Latvia (45.1%, a difference of 0.42%).
| Demographics | Rating | Rank | Bachelor's Degree |
| Immigrants | Sri Lanka | 100.0 /100 | #30 | Exceptional 46.1% |
| Latvians | 100.0 /100 | #31 | Exceptional 46.1% |
| Immigrants | Turkey | 100.0 /100 | #32 | Exceptional 46.0% |
| Immigrants | Northern Europe | 100.0 /100 | #33 | Exceptional 45.6% |
| Immigrants | Denmark | 100.0 /100 | #34 | Exceptional 45.4% |
| Immigrants | Russia | 100.0 /100 | #35 | Exceptional 45.4% |
| Mongolians | 100.0 /100 | #36 | Exceptional 45.4% |
| Russians | 100.0 /100 | #37 | Exceptional 45.3% |
| Bulgarians | 100.0 /100 | #38 | Exceptional 45.3% |
| Immigrants | Latvia | 100.0 /100 | #39 | Exceptional 45.1% |
| Immigrants | Belarus | 100.0 /100 | #40 | Exceptional 45.0% |
| Immigrants | Malaysia | 100.0 /100 | #41 | Exceptional 45.0% |
| Immigrants | Saudi Arabia | 100.0 /100 | #42 | Exceptional 44.8% |
| Immigrants | South Africa | 99.9 /100 | #43 | Exceptional 44.8% |
| Immigrants | Lithuania | 99.9 /100 | #44 | Exceptional 44.6% |