Soviet Union vs German Bachelor's Degree
COMPARE
Soviet Union
German
Bachelor's Degree
Bachelor's Degree Comparison
Soviet Union
Germans
47.9%
BACHELOR'S DEGREE
100.0/ 100
METRIC RATING
16th/ 347
METRIC RANK
36.1%
BACHELOR'S DEGREE
13.9/ 100
METRIC RATING
214th/ 347
METRIC RANK
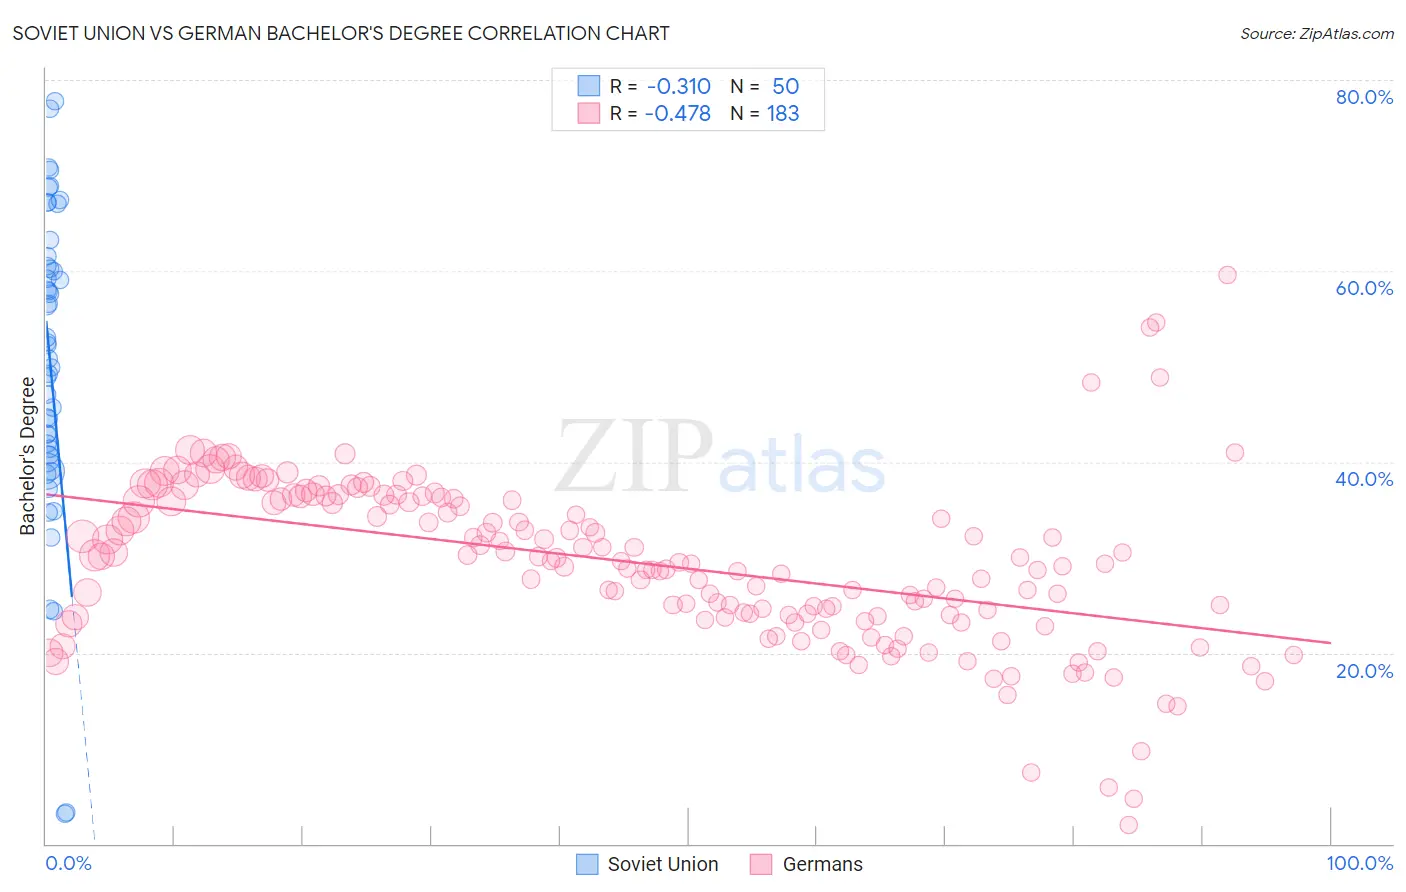
Soviet Union vs German Bachelor's Degree Correlation Chart
The statistical analysis conducted on geographies consisting of 43,514,626 people shows a mild negative correlation between the proportion of Soviet Union and percentage of population with at least bachelor's degree education in the United States with a correlation coefficient (R) of -0.310 and weighted average of 47.9%. Similarly, the statistical analysis conducted on geographies consisting of 580,976,165 people shows a moderate negative correlation between the proportion of Germans and percentage of population with at least bachelor's degree education in the United States with a correlation coefficient (R) of -0.478 and weighted average of 36.1%, a difference of 32.6%.
Bachelor's Degree Correlation Summary
| Measurement | Soviet Union | German |
| Minimum | 3.1% | 2.0% |
| Maximum | 77.7% | 59.5% |
| Range | 74.6% | 57.6% |
| Mean | 50.2% | 29.5% |
| Median | 51.5% | 29.6% |
| Interquartile 25% (IQ1) | 40.7% | 23.8% |
| Interquartile 75% (IQ3) | 60.5% | 36.2% |
| Interquartile Range (IQR) | 19.8% | 12.3% |
| Standard Deviation (Sample) | 16.2% | 8.7% |
| Standard Deviation (Population) | 16.0% | 8.7% |
Similar Demographics by Bachelor's Degree
Demographics Similar to Soviet Union by Bachelor's Degree
In terms of bachelor's degree, the demographic groups most similar to Soviet Union are Immigrants from Eastern Asia (48.1%, a difference of 0.46%), Immigrants from Hong Kong (48.2%, a difference of 0.60%), Eastern European (47.5%, a difference of 0.86%), Immigrants from South Central Asia (48.3%, a difference of 0.88%), and Indian (Asian) (47.4%, a difference of 1.0%).
| Demographics | Rating | Rank | Bachelor's Degree |
| Immigrants | Israel | 100.0 /100 | #9 | Exceptional 50.0% |
| Cypriots | 100.0 /100 | #10 | Exceptional 49.0% |
| Immigrants | Australia | 100.0 /100 | #11 | Exceptional 48.5% |
| Immigrants | China | 100.0 /100 | #12 | Exceptional 48.4% |
| Immigrants | South Central Asia | 100.0 /100 | #13 | Exceptional 48.3% |
| Immigrants | Hong Kong | 100.0 /100 | #14 | Exceptional 48.2% |
| Immigrants | Eastern Asia | 100.0 /100 | #15 | Exceptional 48.1% |
| Soviet Union | 100.0 /100 | #16 | Exceptional 47.9% |
| Eastern Europeans | 100.0 /100 | #17 | Exceptional 47.5% |
| Indians (Asian) | 100.0 /100 | #18 | Exceptional 47.4% |
| Cambodians | 100.0 /100 | #19 | Exceptional 47.2% |
| Immigrants | Switzerland | 100.0 /100 | #20 | Exceptional 47.1% |
| Immigrants | Ireland | 100.0 /100 | #21 | Exceptional 47.1% |
| Immigrants | Belgium | 100.0 /100 | #22 | Exceptional 47.0% |
| Immigrants | Sweden | 100.0 /100 | #23 | Exceptional 47.0% |
Demographics Similar to Germans by Bachelor's Degree
In terms of bachelor's degree, the demographic groups most similar to Germans are Immigrants from Western Africa (36.1%, a difference of 0.030%), Immigrants from Panama (36.2%, a difference of 0.060%), Barbadian (36.1%, a difference of 0.090%), Immigrants from Philippines (36.4%, a difference of 0.75%), and Scotch-Irish (36.4%, a difference of 0.83%).
| Demographics | Rating | Rank | Bachelor's Degree |
| Immigrants | Middle Africa | 20.6 /100 | #207 | Fair 36.6% |
| Immigrants | Thailand | 19.4 /100 | #208 | Poor 36.5% |
| Panamanians | 18.8 /100 | #209 | Poor 36.5% |
| French | 18.6 /100 | #210 | Poor 36.5% |
| Scotch-Irish | 18.3 /100 | #211 | Poor 36.4% |
| Immigrants | Philippines | 17.8 /100 | #212 | Poor 36.4% |
| Immigrants | Panama | 14.2 /100 | #213 | Poor 36.2% |
| Germans | 13.9 /100 | #214 | Poor 36.1% |
| Immigrants | Western Africa | 13.8 /100 | #215 | Poor 36.1% |
| Barbadians | 13.5 /100 | #216 | Poor 36.1% |
| German Russians | 10.2 /100 | #217 | Poor 35.8% |
| Sub-Saharan Africans | 9.8 /100 | #218 | Tragic 35.8% |
| West Indians | 9.7 /100 | #219 | Tragic 35.8% |
| Spanish | 9.6 /100 | #220 | Tragic 35.8% |
| Dutch | 9.2 /100 | #221 | Tragic 35.7% |