Soviet Union vs Immigrants from Albania 6th Grade
COMPARE
Soviet Union
Immigrants from Albania
6th Grade
6th Grade Comparison
Soviet Union
Immigrants from Albania
97.2%
6TH GRADE
71.5/ 100
METRIC RATING
154th/ 347
METRIC RANK
96.9%
6TH GRADE
18.8/ 100
METRIC RATING
198th/ 347
METRIC RANK
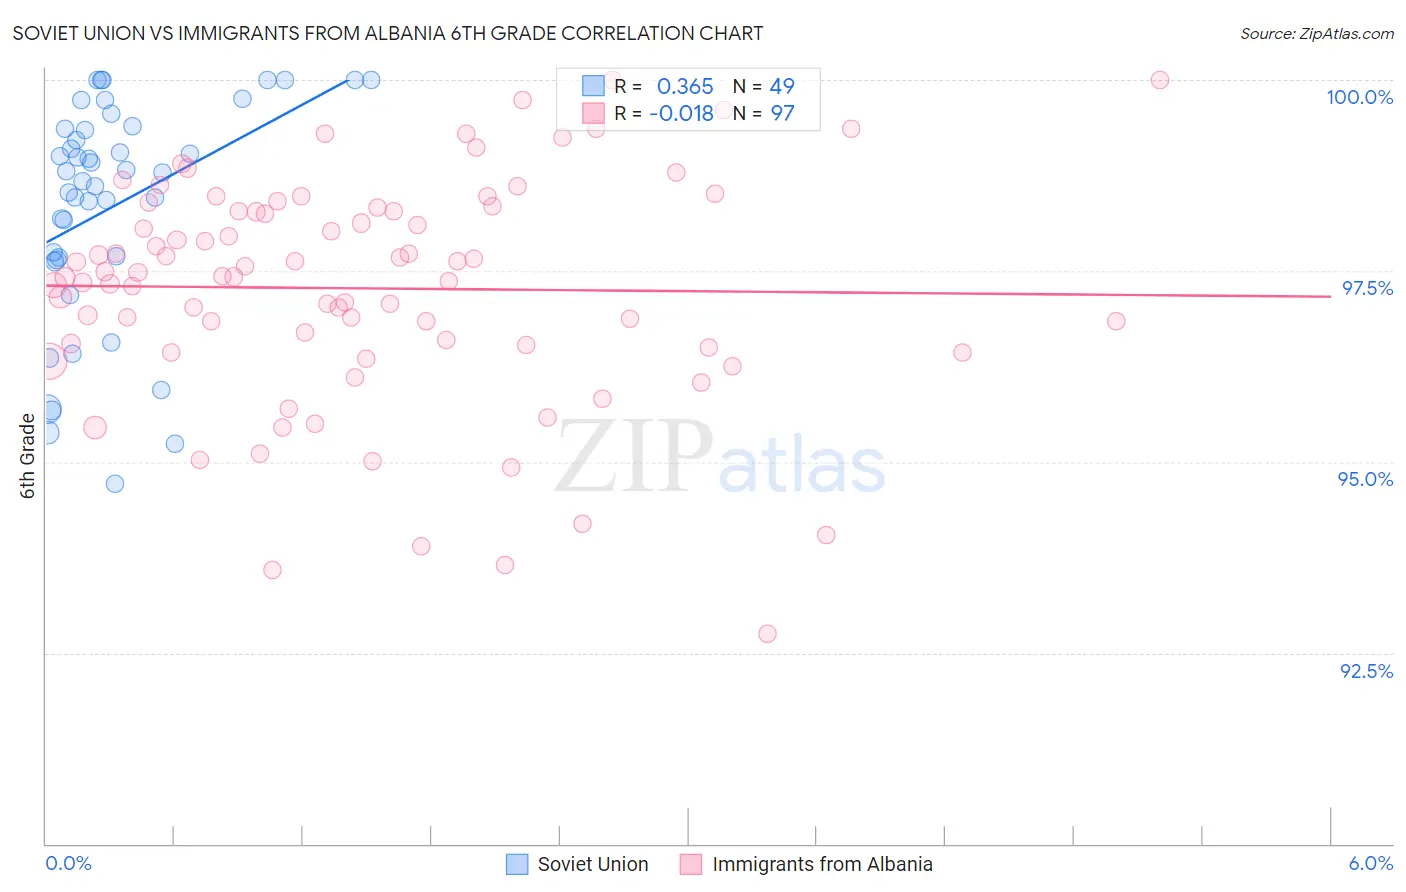
Soviet Union vs Immigrants from Albania 6th Grade Correlation Chart
The statistical analysis conducted on geographies consisting of 43,454,395 people shows a mild positive correlation between the proportion of Soviet Union and percentage of population with at least 6th grade education in the United States with a correlation coefficient (R) of 0.365 and weighted average of 97.2%. Similarly, the statistical analysis conducted on geographies consisting of 119,265,453 people shows no correlation between the proportion of Immigrants from Albania and percentage of population with at least 6th grade education in the United States with a correlation coefficient (R) of -0.018 and weighted average of 96.9%, a difference of 0.27%.
6th Grade Correlation Summary
| Measurement | Soviet Union | Immigrants from Albania |
| Minimum | 94.7% | 92.8% |
| Maximum | 100.0% | 100.0% |
| Range | 5.3% | 7.2% |
| Mean | 98.3% | 97.3% |
| Median | 98.8% | 97.4% |
| Interquartile 25% (IQ1) | 97.7% | 96.5% |
| Interquartile 75% (IQ3) | 99.4% | 98.3% |
| Interquartile Range (IQR) | 1.7% | 1.8% |
| Standard Deviation (Sample) | 1.4% | 1.5% |
| Standard Deviation (Population) | 1.4% | 1.5% |
Similar Demographics by 6th Grade
Demographics Similar to Soviet Union by 6th Grade
In terms of 6th grade, the demographic groups most similar to Soviet Union are Ute (97.1%, a difference of 0.0%), French American Indian (97.2%, a difference of 0.010%), Immigrants from Jordan (97.2%, a difference of 0.010%), Immigrants from Eastern Europe (97.2%, a difference of 0.010%), and Alsatian (97.1%, a difference of 0.010%).
| Demographics | Rating | Rank | 6th Grade |
| Immigrants | South Central Asia | 78.1 /100 | #147 | Good 97.2% |
| Immigrants | Greece | 77.8 /100 | #148 | Good 97.2% |
| Immigrants | Israel | 76.0 /100 | #149 | Good 97.2% |
| Immigrants | Bosnia and Herzegovina | 74.8 /100 | #150 | Good 97.2% |
| French American Indians | 74.0 /100 | #151 | Good 97.2% |
| Immigrants | Jordan | 73.0 /100 | #152 | Good 97.2% |
| Immigrants | Eastern Europe | 72.6 /100 | #153 | Good 97.2% |
| Soviet Union | 71.5 /100 | #154 | Good 97.2% |
| Ute | 71.1 /100 | #155 | Good 97.1% |
| Alsatians | 69.8 /100 | #156 | Good 97.1% |
| Immigrants | Russia | 67.6 /100 | #157 | Good 97.1% |
| Immigrants | Iran | 63.3 /100 | #158 | Good 97.1% |
| Kenyans | 62.9 /100 | #159 | Good 97.1% |
| Ugandans | 62.2 /100 | #160 | Good 97.1% |
| Immigrants | Belarus | 60.4 /100 | #161 | Good 97.1% |
Demographics Similar to Immigrants from Albania by 6th Grade
In terms of 6th grade, the demographic groups most similar to Immigrants from Albania are Brazilian (96.9%, a difference of 0.010%), Immigrants from Uganda (96.9%, a difference of 0.020%), Immigrants from Northern Africa (96.9%, a difference of 0.020%), African (96.9%, a difference of 0.030%), and Immigrants from Brazil (96.9%, a difference of 0.040%).
| Demographics | Rating | Rank | 6th Grade |
| Panamanians | 27.3 /100 | #191 | Fair 96.9% |
| Hawaiians | 27.0 /100 | #192 | Fair 96.9% |
| Paraguayans | 26.6 /100 | #193 | Fair 96.9% |
| Immigrants | Lebanon | 25.6 /100 | #194 | Fair 96.9% |
| Immigrants | Brazil | 25.5 /100 | #195 | Fair 96.9% |
| Immigrants | Uganda | 21.2 /100 | #196 | Fair 96.9% |
| Brazilians | 20.1 /100 | #197 | Fair 96.9% |
| Immigrants | Albania | 18.8 /100 | #198 | Poor 96.9% |
| Immigrants | Northern Africa | 15.7 /100 | #199 | Poor 96.9% |
| Africans | 14.8 /100 | #200 | Poor 96.9% |
| Immigrants | Zaire | 14.5 /100 | #201 | Poor 96.9% |
| Immigrants | Chile | 14.2 /100 | #202 | Poor 96.8% |
| Sudanese | 13.9 /100 | #203 | Poor 96.8% |
| Immigrants | Bahamas | 13.8 /100 | #204 | Poor 96.8% |
| Natives/Alaskans | 13.0 /100 | #205 | Poor 96.8% |