Pakistani vs Immigrants from Albania 6th Grade
COMPARE
Pakistani
Immigrants from Albania
6th Grade
6th Grade Comparison
Pakistanis
Immigrants from Albania
97.0%
6TH GRADE
46.0/ 100
METRIC RATING
178th/ 347
METRIC RANK
96.9%
6TH GRADE
18.8/ 100
METRIC RATING
198th/ 347
METRIC RANK
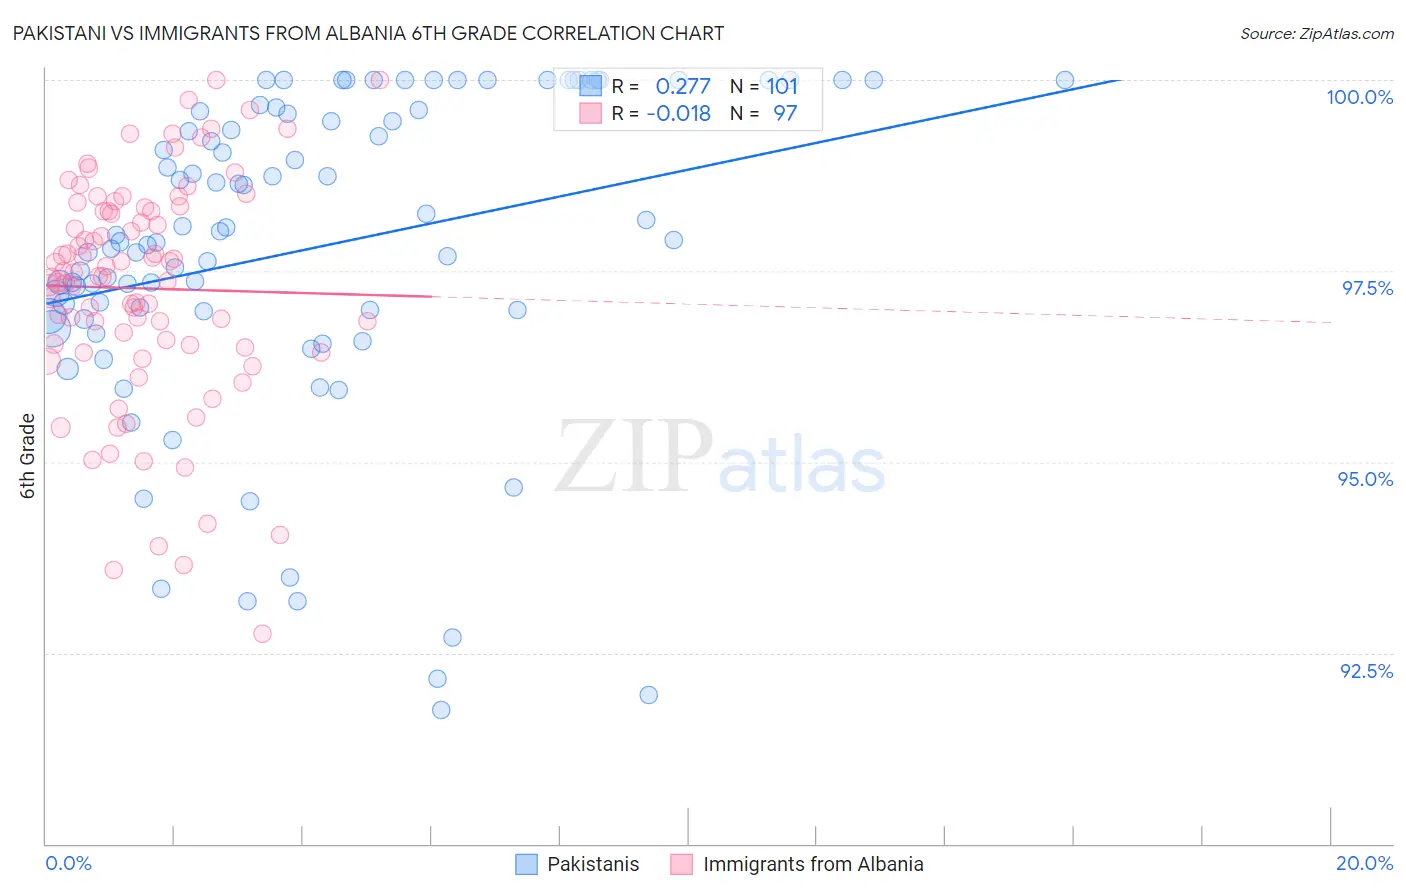
Pakistani vs Immigrants from Albania 6th Grade Correlation Chart
The statistical analysis conducted on geographies consisting of 335,355,370 people shows a weak positive correlation between the proportion of Pakistanis and percentage of population with at least 6th grade education in the United States with a correlation coefficient (R) of 0.277 and weighted average of 97.0%. Similarly, the statistical analysis conducted on geographies consisting of 119,265,453 people shows no correlation between the proportion of Immigrants from Albania and percentage of population with at least 6th grade education in the United States with a correlation coefficient (R) of -0.018 and weighted average of 96.9%, a difference of 0.15%.
6th Grade Correlation Summary
| Measurement | Pakistani | Immigrants from Albania |
| Minimum | 91.8% | 92.8% |
| Maximum | 100.0% | 100.0% |
| Range | 8.2% | 7.2% |
| Mean | 97.8% | 97.3% |
| Median | 97.9% | 97.4% |
| Interquartile 25% (IQ1) | 96.9% | 96.5% |
| Interquartile 75% (IQ3) | 99.6% | 98.3% |
| Interquartile Range (IQR) | 2.7% | 1.8% |
| Standard Deviation (Sample) | 2.1% | 1.5% |
| Standard Deviation (Population) | 2.1% | 1.5% |
Demographics Similar to Pakistanis and Immigrants from Albania by 6th Grade
In terms of 6th grade, the demographic groups most similar to Pakistanis are Immigrants from Kenya (97.0%, a difference of 0.0%), Immigrants from Spain (97.0%, a difference of 0.030%), Comanche (97.0%, a difference of 0.040%), Immigrants from Ukraine (97.0%, a difference of 0.050%), and Immigrants from Venezuela (97.0%, a difference of 0.050%). Similarly, the demographic groups most similar to Immigrants from Albania are Brazilian (96.9%, a difference of 0.010%), Immigrants from Uganda (96.9%, a difference of 0.020%), Immigrants from Brazil (96.9%, a difference of 0.040%), Hawaiian (96.9%, a difference of 0.050%), and Paraguayan (96.9%, a difference of 0.050%).
| Demographics | Rating | Rank | 6th Grade |
| Pakistanis | 46.0 /100 | #178 | Average 97.0% |
| Immigrants | Kenya | 45.3 /100 | #179 | Average 97.0% |
| Immigrants | Spain | 39.9 /100 | #180 | Fair 97.0% |
| Comanche | 37.9 /100 | #181 | Fair 97.0% |
| Immigrants | Ukraine | 35.6 /100 | #182 | Fair 97.0% |
| Immigrants | Venezuela | 34.5 /100 | #183 | Fair 97.0% |
| Spanish Americans | 33.5 /100 | #184 | Fair 97.0% |
| Argentineans | 33.0 /100 | #185 | Fair 97.0% |
| Immigrants | Egypt | 31.4 /100 | #186 | Fair 97.0% |
| Guamanians/Chamorros | 30.6 /100 | #187 | Fair 97.0% |
| Immigrants | Argentina | 30.4 /100 | #188 | Fair 97.0% |
| Blacks/African Americans | 30.2 /100 | #189 | Fair 97.0% |
| Dutch West Indians | 28.3 /100 | #190 | Fair 96.9% |
| Panamanians | 27.3 /100 | #191 | Fair 96.9% |
| Hawaiians | 27.0 /100 | #192 | Fair 96.9% |
| Paraguayans | 26.6 /100 | #193 | Fair 96.9% |
| Immigrants | Lebanon | 25.6 /100 | #194 | Fair 96.9% |
| Immigrants | Brazil | 25.5 /100 | #195 | Fair 96.9% |
| Immigrants | Uganda | 21.2 /100 | #196 | Fair 96.9% |
| Brazilians | 20.1 /100 | #197 | Fair 96.9% |
| Immigrants | Albania | 18.8 /100 | #198 | Poor 96.9% |