Immigrants from Dominica vs Immigrants from Albania 6th Grade
COMPARE
Immigrants from Dominica
Immigrants from Albania
6th Grade
6th Grade Comparison
Immigrants from Dominica
Immigrants from Albania
95.7%
6TH GRADE
0.0/ 100
METRIC RATING
300th/ 347
METRIC RANK
96.9%
6TH GRADE
18.8/ 100
METRIC RATING
198th/ 347
METRIC RANK
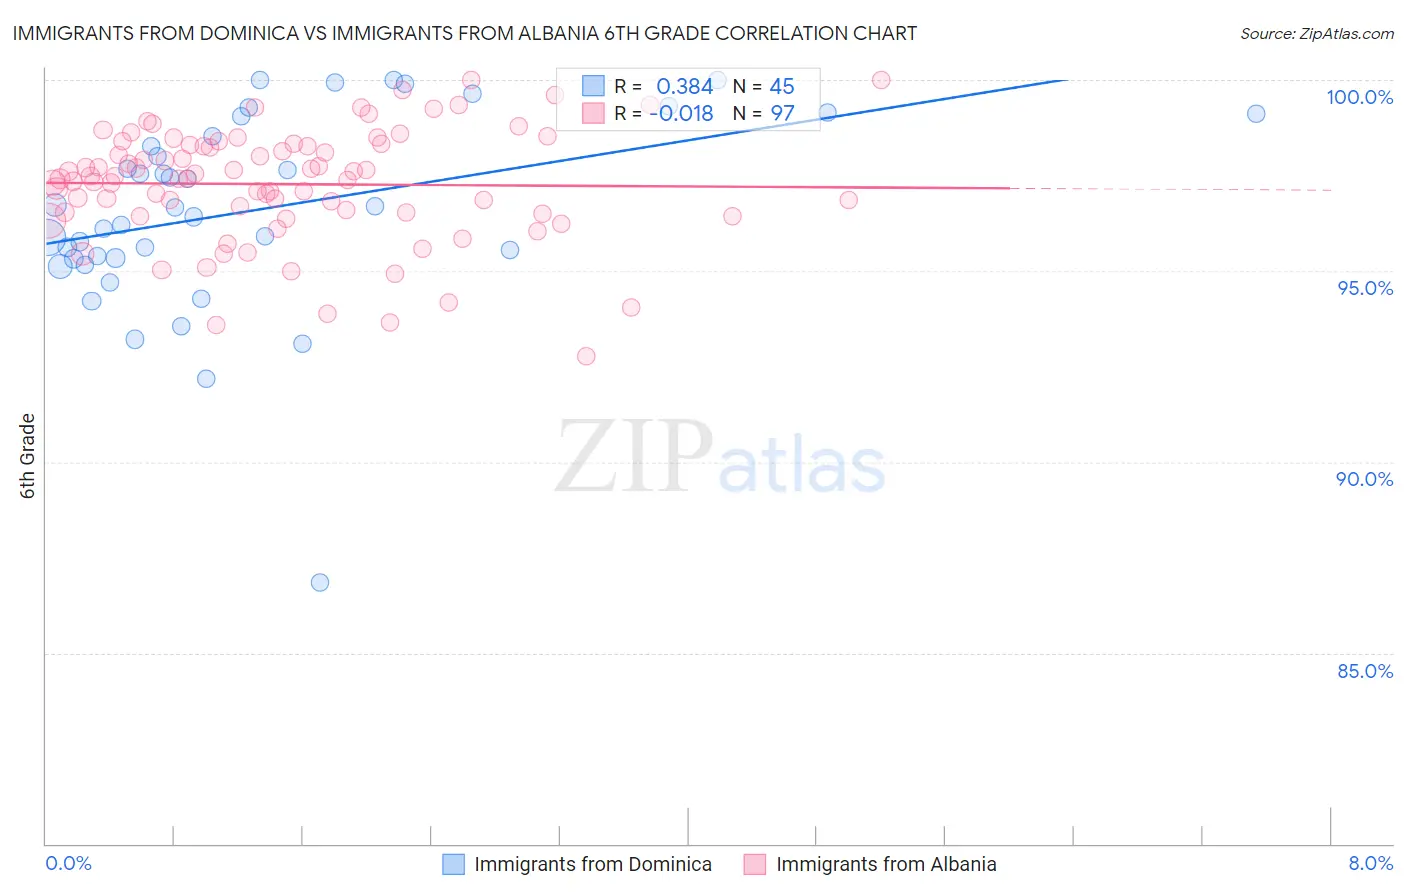
Immigrants from Dominica vs Immigrants from Albania 6th Grade Correlation Chart
The statistical analysis conducted on geographies consisting of 83,794,115 people shows a mild positive correlation between the proportion of Immigrants from Dominica and percentage of population with at least 6th grade education in the United States with a correlation coefficient (R) of 0.384 and weighted average of 95.7%. Similarly, the statistical analysis conducted on geographies consisting of 119,265,453 people shows no correlation between the proportion of Immigrants from Albania and percentage of population with at least 6th grade education in the United States with a correlation coefficient (R) of -0.018 and weighted average of 96.9%, a difference of 1.2%.
6th Grade Correlation Summary
| Measurement | Immigrants from Dominica | Immigrants from Albania |
| Minimum | 86.8% | 92.8% |
| Maximum | 100.0% | 100.0% |
| Range | 13.2% | 7.2% |
| Mean | 96.6% | 97.3% |
| Median | 96.7% | 97.4% |
| Interquartile 25% (IQ1) | 95.3% | 96.5% |
| Interquartile 75% (IQ3) | 98.8% | 98.3% |
| Interquartile Range (IQR) | 3.5% | 1.8% |
| Standard Deviation (Sample) | 2.6% | 1.5% |
| Standard Deviation (Population) | 2.5% | 1.5% |
Similar Demographics by 6th Grade
Demographics Similar to Immigrants from Dominica by 6th Grade
In terms of 6th grade, the demographic groups most similar to Immigrants from Dominica are Immigrants from Laos (95.7%, a difference of 0.010%), Immigrants (95.7%, a difference of 0.010%), Immigrants from Burma/Myanmar (95.7%, a difference of 0.020%), Sri Lankan (95.8%, a difference of 0.030%), and Haitian (95.8%, a difference of 0.090%).
| Demographics | Rating | Rank | 6th Grade |
| Immigrants | West Indies | 0.0 /100 | #293 | Tragic 96.1% |
| British West Indians | 0.0 /100 | #294 | Tragic 96.0% |
| Immigrants | Grenada | 0.0 /100 | #295 | Tragic 95.9% |
| Immigrants | South Eastern Asia | 0.0 /100 | #296 | Tragic 95.9% |
| Haitians | 0.0 /100 | #297 | Tragic 95.8% |
| Sri Lankans | 0.0 /100 | #298 | Tragic 95.8% |
| Immigrants | Laos | 0.0 /100 | #299 | Tragic 95.7% |
| Immigrants | Dominica | 0.0 /100 | #300 | Tragic 95.7% |
| Immigrants | Immigrants | 0.0 /100 | #301 | Tragic 95.7% |
| Immigrants | Burma/Myanmar | 0.0 /100 | #302 | Tragic 95.7% |
| Bangladeshis | 0.0 /100 | #303 | Tragic 95.7% |
| Indonesians | 0.0 /100 | #304 | Tragic 95.6% |
| Immigrants | Cuba | 0.0 /100 | #305 | Tragic 95.6% |
| Immigrants | Haiti | 0.0 /100 | #306 | Tragic 95.6% |
| Guyanese | 0.0 /100 | #307 | Tragic 95.6% |
Demographics Similar to Immigrants from Albania by 6th Grade
In terms of 6th grade, the demographic groups most similar to Immigrants from Albania are Brazilian (96.9%, a difference of 0.010%), Immigrants from Uganda (96.9%, a difference of 0.020%), Immigrants from Northern Africa (96.9%, a difference of 0.020%), African (96.9%, a difference of 0.030%), and Immigrants from Brazil (96.9%, a difference of 0.040%).
| Demographics | Rating | Rank | 6th Grade |
| Panamanians | 27.3 /100 | #191 | Fair 96.9% |
| Hawaiians | 27.0 /100 | #192 | Fair 96.9% |
| Paraguayans | 26.6 /100 | #193 | Fair 96.9% |
| Immigrants | Lebanon | 25.6 /100 | #194 | Fair 96.9% |
| Immigrants | Brazil | 25.5 /100 | #195 | Fair 96.9% |
| Immigrants | Uganda | 21.2 /100 | #196 | Fair 96.9% |
| Brazilians | 20.1 /100 | #197 | Fair 96.9% |
| Immigrants | Albania | 18.8 /100 | #198 | Poor 96.9% |
| Immigrants | Northern Africa | 15.7 /100 | #199 | Poor 96.9% |
| Africans | 14.8 /100 | #200 | Poor 96.9% |
| Immigrants | Zaire | 14.5 /100 | #201 | Poor 96.9% |
| Immigrants | Chile | 14.2 /100 | #202 | Poor 96.8% |
| Sudanese | 13.9 /100 | #203 | Poor 96.8% |
| Immigrants | Bahamas | 13.8 /100 | #204 | Poor 96.8% |
| Natives/Alaskans | 13.0 /100 | #205 | Poor 96.8% |