Immigrants from England vs German Bachelor's Degree
COMPARE
Immigrants from England
German
Bachelor's Degree
Bachelor's Degree Comparison
Immigrants from England
Germans
41.4%
BACHELOR'S DEGREE
98.1/ 100
METRIC RATING
99th/ 347
METRIC RANK
36.1%
BACHELOR'S DEGREE
13.9/ 100
METRIC RATING
214th/ 347
METRIC RANK
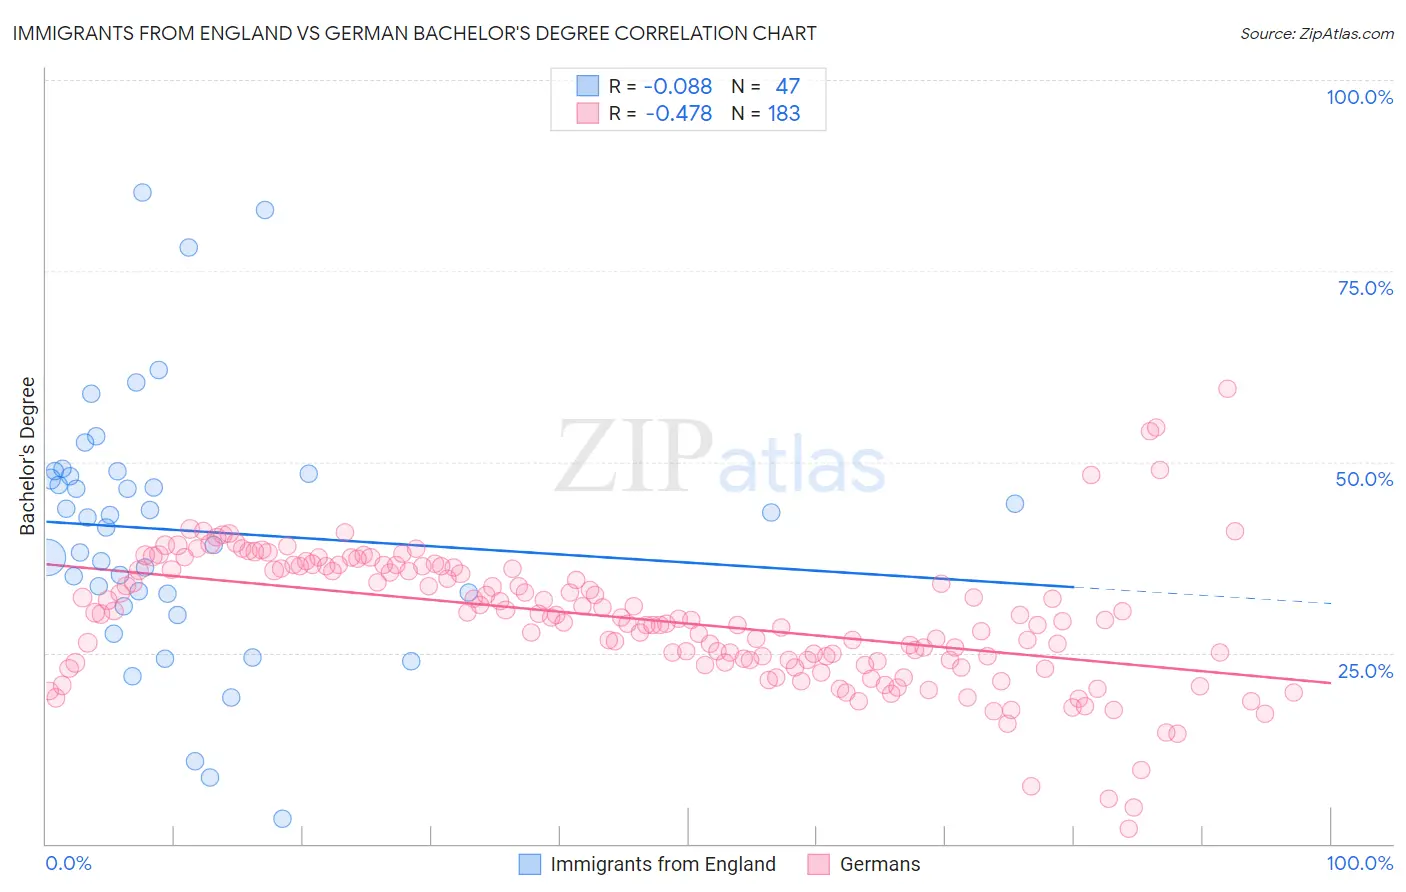
Immigrants from England vs German Bachelor's Degree Correlation Chart
The statistical analysis conducted on geographies consisting of 391,879,677 people shows a slight negative correlation between the proportion of Immigrants from England and percentage of population with at least bachelor's degree education in the United States with a correlation coefficient (R) of -0.088 and weighted average of 41.4%. Similarly, the statistical analysis conducted on geographies consisting of 580,976,165 people shows a moderate negative correlation between the proportion of Germans and percentage of population with at least bachelor's degree education in the United States with a correlation coefficient (R) of -0.478 and weighted average of 36.1%, a difference of 14.7%.
Bachelor's Degree Correlation Summary
| Measurement | Immigrants from England | German |
| Minimum | 3.3% | 2.0% |
| Maximum | 85.3% | 59.5% |
| Range | 82.0% | 57.6% |
| Mean | 41.0% | 29.5% |
| Median | 42.7% | 29.6% |
| Interquartile 25% (IQ1) | 32.7% | 23.8% |
| Interquartile 75% (IQ3) | 48.4% | 36.2% |
| Interquartile Range (IQR) | 15.7% | 12.3% |
| Standard Deviation (Sample) | 16.7% | 8.7% |
| Standard Deviation (Population) | 16.6% | 8.7% |
Similar Demographics by Bachelor's Degree
Demographics Similar to Immigrants from England by Bachelor's Degree
In terms of bachelor's degree, the demographic groups most similar to Immigrants from England are Macedonian (41.4%, a difference of 0.030%), Immigrants from Morocco (41.4%, a difference of 0.060%), Immigrants from Ukraine (41.5%, a difference of 0.24%), Immigrants from Italy (41.3%, a difference of 0.32%), and Romanian (41.6%, a difference of 0.35%).
| Demographics | Rating | Rank | Bachelor's Degree |
| Maltese | 98.8 /100 | #92 | Exceptional 41.9% |
| Immigrants | Canada | 98.6 /100 | #93 | Exceptional 41.7% |
| Immigrants | Nepal | 98.6 /100 | #94 | Exceptional 41.7% |
| Immigrants | North America | 98.5 /100 | #95 | Exceptional 41.7% |
| Immigrants | Moldova | 98.4 /100 | #96 | Exceptional 41.6% |
| Romanians | 98.4 /100 | #97 | Exceptional 41.6% |
| Immigrants | Ukraine | 98.3 /100 | #98 | Exceptional 41.5% |
| Immigrants | England | 98.1 /100 | #99 | Exceptional 41.4% |
| Macedonians | 98.1 /100 | #100 | Exceptional 41.4% |
| Immigrants | Morocco | 98.0 /100 | #101 | Exceptional 41.4% |
| Immigrants | Italy | 97.8 /100 | #102 | Exceptional 41.3% |
| Chileans | 97.5 /100 | #103 | Exceptional 41.2% |
| Jordanians | 97.4 /100 | #104 | Exceptional 41.2% |
| Syrians | 97.4 /100 | #105 | Exceptional 41.1% |
| Alsatians | 97.0 /100 | #106 | Exceptional 41.0% |
Demographics Similar to Germans by Bachelor's Degree
In terms of bachelor's degree, the demographic groups most similar to Germans are Immigrants from Western Africa (36.1%, a difference of 0.030%), Immigrants from Panama (36.2%, a difference of 0.060%), Barbadian (36.1%, a difference of 0.090%), Immigrants from Philippines (36.4%, a difference of 0.75%), and Scotch-Irish (36.4%, a difference of 0.83%).
| Demographics | Rating | Rank | Bachelor's Degree |
| Immigrants | Middle Africa | 20.6 /100 | #207 | Fair 36.6% |
| Immigrants | Thailand | 19.4 /100 | #208 | Poor 36.5% |
| Panamanians | 18.8 /100 | #209 | Poor 36.5% |
| French | 18.6 /100 | #210 | Poor 36.5% |
| Scotch-Irish | 18.3 /100 | #211 | Poor 36.4% |
| Immigrants | Philippines | 17.8 /100 | #212 | Poor 36.4% |
| Immigrants | Panama | 14.2 /100 | #213 | Poor 36.2% |
| Germans | 13.9 /100 | #214 | Poor 36.1% |
| Immigrants | Western Africa | 13.8 /100 | #215 | Poor 36.1% |
| Barbadians | 13.5 /100 | #216 | Poor 36.1% |
| German Russians | 10.2 /100 | #217 | Poor 35.8% |
| Sub-Saharan Africans | 9.8 /100 | #218 | Tragic 35.8% |
| West Indians | 9.7 /100 | #219 | Tragic 35.8% |
| Spanish | 9.6 /100 | #220 | Tragic 35.8% |
| Dutch | 9.2 /100 | #221 | Tragic 35.7% |