South American Indian vs Immigrants from China Kindergarten
COMPARE
South American Indian
Immigrants from China
Kindergarten
Kindergarten Comparison
South American Indians
Immigrants from China
97.8%
KINDERGARTEN
7.7/ 100
METRIC RATING
213th/ 347
METRIC RANK
97.4%
KINDERGARTEN
0.1/ 100
METRIC RATING
273rd/ 347
METRIC RANK
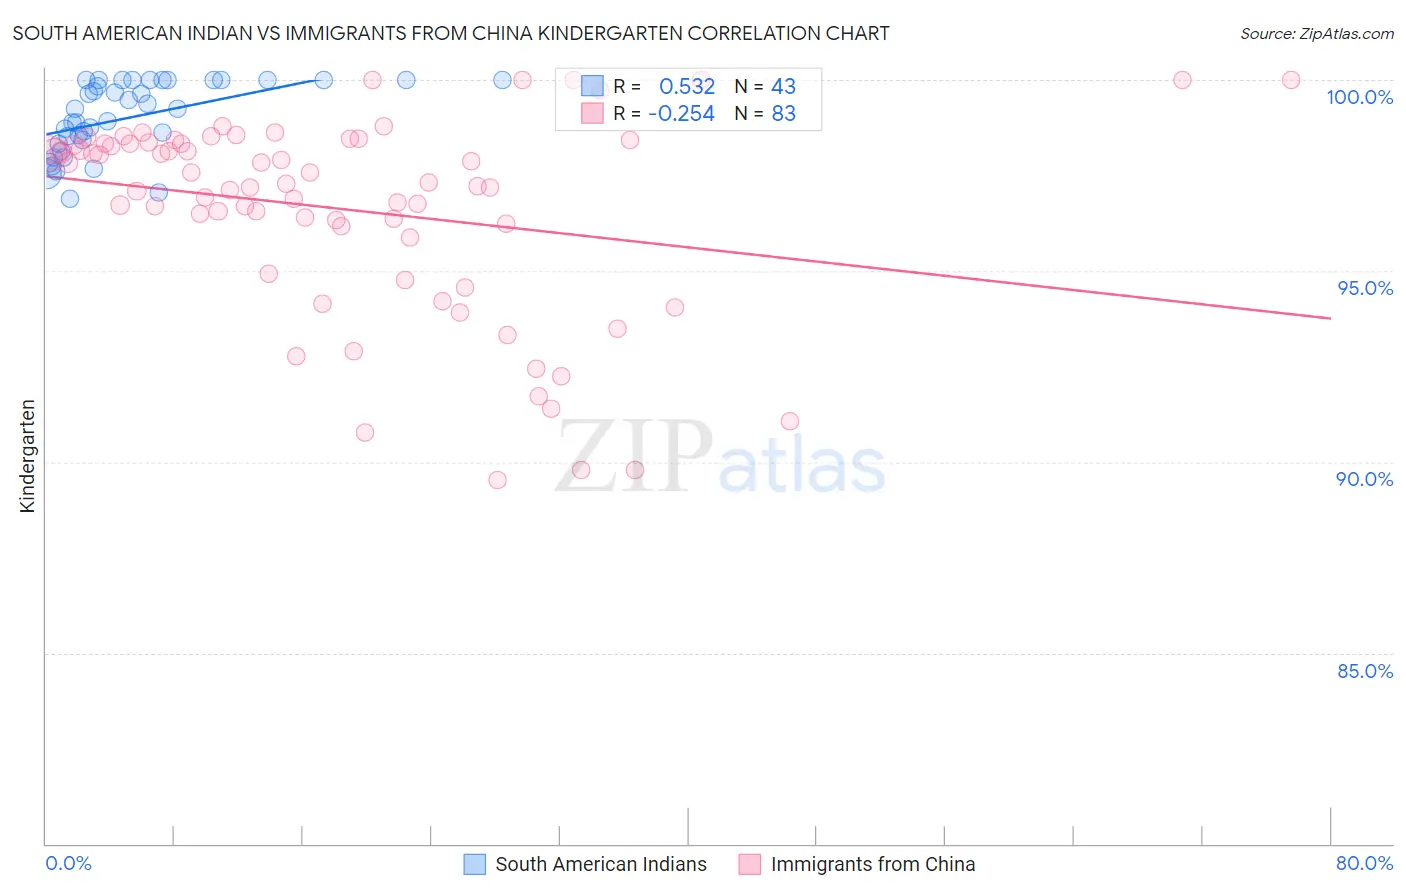
South American Indian vs Immigrants from China Kindergarten Correlation Chart
The statistical analysis conducted on geographies consisting of 164,573,401 people shows a substantial positive correlation between the proportion of South American Indians and percentage of population with at least kindergarten education in the United States with a correlation coefficient (R) of 0.532 and weighted average of 97.8%. Similarly, the statistical analysis conducted on geographies consisting of 457,082,957 people shows a weak negative correlation between the proportion of Immigrants from China and percentage of population with at least kindergarten education in the United States with a correlation coefficient (R) of -0.254 and weighted average of 97.4%, a difference of 0.33%.
Kindergarten Correlation Summary
| Measurement | South American Indian | Immigrants from China |
| Minimum | 96.9% | 89.5% |
| Maximum | 100.0% | 100.0% |
| Range | 3.1% | 10.5% |
| Mean | 99.0% | 96.6% |
| Median | 99.2% | 97.3% |
| Interquartile 25% (IQ1) | 98.3% | 95.9% |
| Interquartile 75% (IQ3) | 100.0% | 98.3% |
| Interquartile Range (IQR) | 1.7% | 2.5% |
| Standard Deviation (Sample) | 0.94% | 2.6% |
| Standard Deviation (Population) | 0.93% | 2.6% |
Similar Demographics by Kindergarten
Demographics Similar to South American Indians by Kindergarten
In terms of kindergarten, the demographic groups most similar to South American Indians are Uruguayan (97.8%, a difference of 0.0%), Immigrants from Bahamas (97.8%, a difference of 0.0%), Moroccan (97.8%, a difference of 0.010%), Samoan (97.8%, a difference of 0.010%), and Bahamian (97.8%, a difference of 0.010%).
| Demographics | Rating | Rank | Kindergarten |
| Immigrants | Albania | 16.4 /100 | #206 | Poor 97.8% |
| Africans | 16.1 /100 | #207 | Poor 97.8% |
| Immigrants | Northern Africa | 12.0 /100 | #208 | Poor 97.8% |
| Costa Ricans | 11.6 /100 | #209 | Poor 97.8% |
| Immigrants | Oceania | 11.1 /100 | #210 | Poor 97.8% |
| Laotians | 10.5 /100 | #211 | Poor 97.8% |
| Moroccans | 8.9 /100 | #212 | Tragic 97.8% |
| South American Indians | 7.7 /100 | #213 | Tragic 97.8% |
| Uruguayans | 7.5 /100 | #214 | Tragic 97.8% |
| Immigrants | Bahamas | 7.4 /100 | #215 | Tragic 97.8% |
| Samoans | 6.9 /100 | #216 | Tragic 97.8% |
| Bahamians | 6.6 /100 | #217 | Tragic 97.8% |
| Immigrants | Morocco | 5.4 /100 | #218 | Tragic 97.7% |
| Immigrants | Panama | 5.0 /100 | #219 | Tragic 97.7% |
| Tongans | 4.8 /100 | #220 | Tragic 97.7% |
Demographics Similar to Immigrants from China by Kindergarten
In terms of kindergarten, the demographic groups most similar to Immigrants from China are Immigrants from Cameroon (97.4%, a difference of 0.0%), Ghanaian (97.4%, a difference of 0.0%), Immigrants from Bolivia (97.5%, a difference of 0.020%), Immigrants from Philippines (97.4%, a difference of 0.020%), and Immigrants from Peru (97.5%, a difference of 0.030%).
| Demographics | Rating | Rank | Kindergarten |
| Immigrants | Sierra Leone | 0.3 /100 | #266 | Tragic 97.5% |
| Immigrants | Liberia | 0.3 /100 | #267 | Tragic 97.5% |
| Immigrants | Nigeria | 0.3 /100 | #268 | Tragic 97.5% |
| West Indians | 0.3 /100 | #269 | Tragic 97.5% |
| Immigrants | Jamaica | 0.2 /100 | #270 | Tragic 97.5% |
| Immigrants | Peru | 0.2 /100 | #271 | Tragic 97.5% |
| Immigrants | Bolivia | 0.2 /100 | #272 | Tragic 97.5% |
| Immigrants | China | 0.1 /100 | #273 | Tragic 97.4% |
| Immigrants | Cameroon | 0.1 /100 | #274 | Tragic 97.4% |
| Ghanaians | 0.1 /100 | #275 | Tragic 97.4% |
| Immigrants | Philippines | 0.1 /100 | #276 | Tragic 97.4% |
| Immigrants | Western Africa | 0.1 /100 | #277 | Tragic 97.4% |
| Immigrants | Uzbekistan | 0.1 /100 | #278 | Tragic 97.4% |
| Immigrants | Ghana | 0.1 /100 | #279 | Tragic 97.4% |
| Barbadians | 0.1 /100 | #280 | Tragic 97.4% |