South American Indian vs Immigrants from Dominica Kindergarten
COMPARE
South American Indian
Immigrants from Dominica
Kindergarten
Kindergarten Comparison
South American Indians
Immigrants from Dominica
97.8%
KINDERGARTEN
7.7/ 100
METRIC RATING
213th/ 347
METRIC RANK
97.1%
KINDERGARTEN
0.0/ 100
METRIC RATING
298th/ 347
METRIC RANK
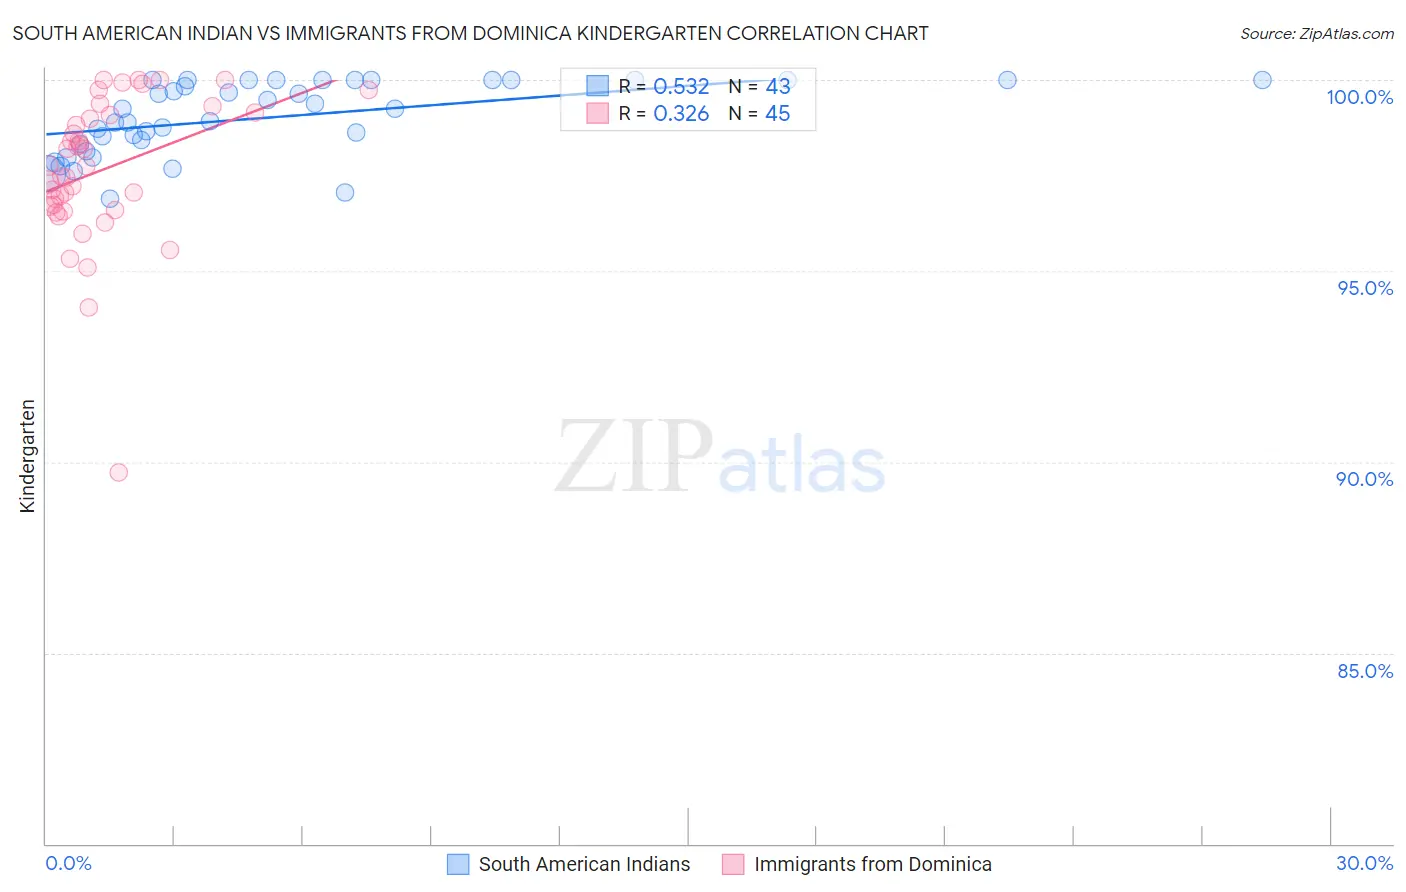
South American Indian vs Immigrants from Dominica Kindergarten Correlation Chart
The statistical analysis conducted on geographies consisting of 164,573,401 people shows a substantial positive correlation between the proportion of South American Indians and percentage of population with at least kindergarten education in the United States with a correlation coefficient (R) of 0.532 and weighted average of 97.8%. Similarly, the statistical analysis conducted on geographies consisting of 83,794,115 people shows a mild positive correlation between the proportion of Immigrants from Dominica and percentage of population with at least kindergarten education in the United States with a correlation coefficient (R) of 0.326 and weighted average of 97.1%, a difference of 0.64%.
Kindergarten Correlation Summary
| Measurement | South American Indian | Immigrants from Dominica |
| Minimum | 96.9% | 89.7% |
| Maximum | 100.0% | 100.0% |
| Range | 3.1% | 10.3% |
| Mean | 99.0% | 97.6% |
| Median | 99.2% | 97.7% |
| Interquartile 25% (IQ1) | 98.3% | 96.7% |
| Interquartile 75% (IQ3) | 100.0% | 99.1% |
| Interquartile Range (IQR) | 1.7% | 2.5% |
| Standard Deviation (Sample) | 0.94% | 1.9% |
| Standard Deviation (Population) | 0.93% | 1.9% |
Similar Demographics by Kindergarten
Demographics Similar to South American Indians by Kindergarten
In terms of kindergarten, the demographic groups most similar to South American Indians are Uruguayan (97.8%, a difference of 0.0%), Immigrants from Bahamas (97.8%, a difference of 0.0%), Moroccan (97.8%, a difference of 0.010%), Samoan (97.8%, a difference of 0.010%), and Bahamian (97.8%, a difference of 0.010%).
| Demographics | Rating | Rank | Kindergarten |
| Immigrants | Albania | 16.4 /100 | #206 | Poor 97.8% |
| Africans | 16.1 /100 | #207 | Poor 97.8% |
| Immigrants | Northern Africa | 12.0 /100 | #208 | Poor 97.8% |
| Costa Ricans | 11.6 /100 | #209 | Poor 97.8% |
| Immigrants | Oceania | 11.1 /100 | #210 | Poor 97.8% |
| Laotians | 10.5 /100 | #211 | Poor 97.8% |
| Moroccans | 8.9 /100 | #212 | Tragic 97.8% |
| South American Indians | 7.7 /100 | #213 | Tragic 97.8% |
| Uruguayans | 7.5 /100 | #214 | Tragic 97.8% |
| Immigrants | Bahamas | 7.4 /100 | #215 | Tragic 97.8% |
| Samoans | 6.9 /100 | #216 | Tragic 97.8% |
| Bahamians | 6.6 /100 | #217 | Tragic 97.8% |
| Immigrants | Morocco | 5.4 /100 | #218 | Tragic 97.7% |
| Immigrants | Panama | 5.0 /100 | #219 | Tragic 97.7% |
| Tongans | 4.8 /100 | #220 | Tragic 97.7% |
Demographics Similar to Immigrants from Dominica by Kindergarten
In terms of kindergarten, the demographic groups most similar to Immigrants from Dominica are Immigrants from Cuba (97.1%, a difference of 0.010%), Central American Indian (97.2%, a difference of 0.020%), Haitian (97.1%, a difference of 0.020%), Immigrants from South Eastern Asia (97.1%, a difference of 0.040%), and Immigrants from Caribbean (97.1%, a difference of 0.060%).
| Demographics | Rating | Rank | Kindergarten |
| Houma | 0.0 /100 | #291 | Tragic 97.3% |
| British West Indians | 0.0 /100 | #292 | Tragic 97.3% |
| Malaysians | 0.0 /100 | #293 | Tragic 97.2% |
| Immigrants | Immigrants | 0.0 /100 | #294 | Tragic 97.2% |
| Immigrants | Grenada | 0.0 /100 | #295 | Tragic 97.2% |
| Immigrants | Eritrea | 0.0 /100 | #296 | Tragic 97.2% |
| Central American Indians | 0.0 /100 | #297 | Tragic 97.2% |
| Immigrants | Dominica | 0.0 /100 | #298 | Tragic 97.1% |
| Immigrants | Cuba | 0.0 /100 | #299 | Tragic 97.1% |
| Haitians | 0.0 /100 | #300 | Tragic 97.1% |
| Immigrants | South Eastern Asia | 0.0 /100 | #301 | Tragic 97.1% |
| Immigrants | Caribbean | 0.0 /100 | #302 | Tragic 97.1% |
| Somalis | 0.0 /100 | #303 | Tragic 97.0% |
| Nicaraguans | 0.0 /100 | #304 | Tragic 97.0% |
| Ecuadorians | 0.0 /100 | #305 | Tragic 97.0% |