Slovene vs Puerto Rican Associate's Degree
COMPARE
Slovene
Puerto Rican
Associate's Degree
Associate's Degree Comparison
Slovenes
Puerto Ricans
47.9%
ASSOCIATE'S DEGREE
85.1/ 100
METRIC RATING
139th/ 347
METRIC RANK
40.4%
ASSOCIATE'S DEGREE
0.1/ 100
METRIC RATING
276th/ 347
METRIC RANK
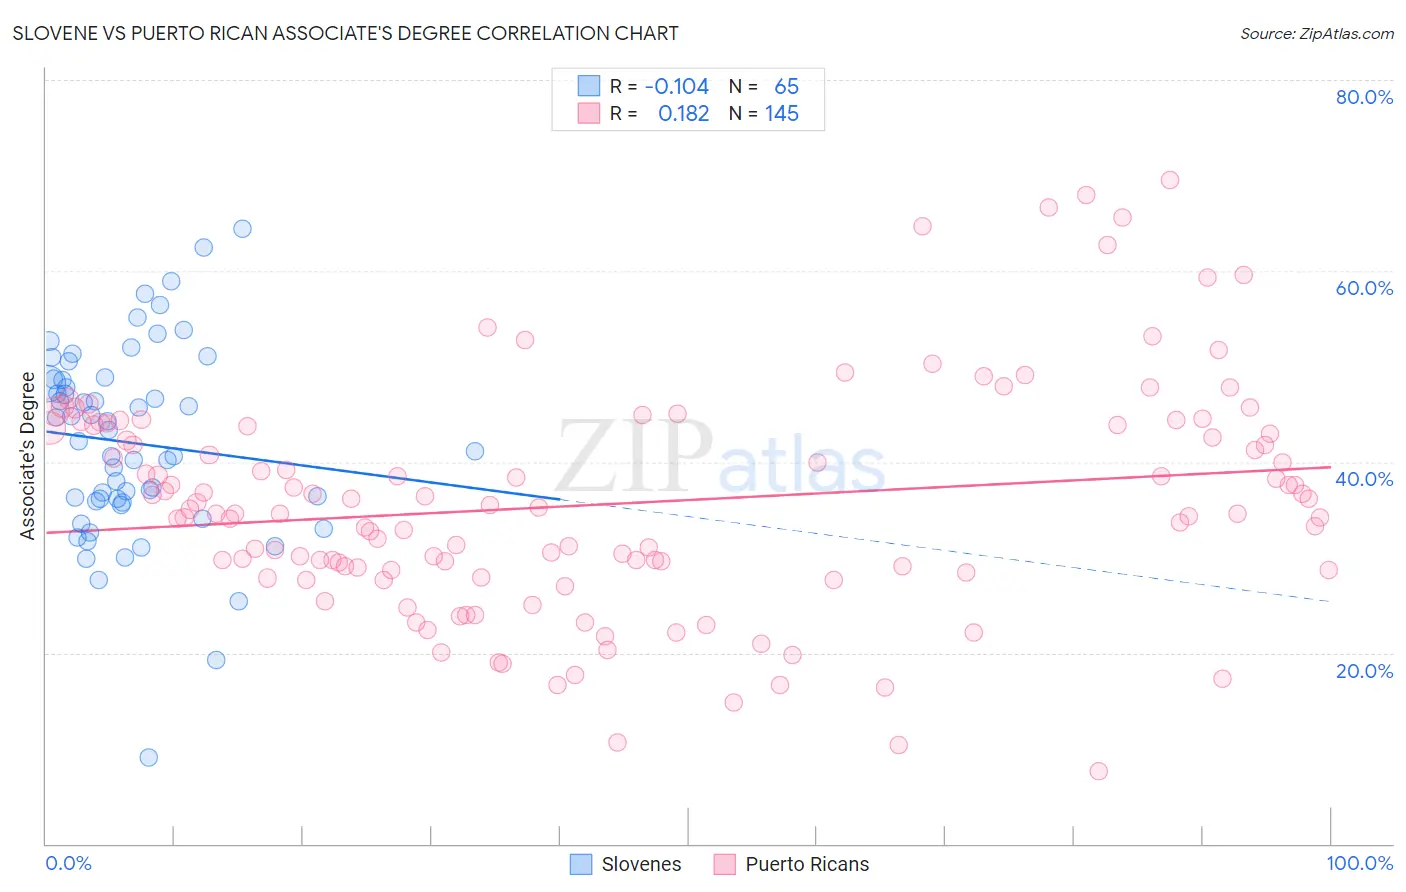
Slovene vs Puerto Rican Associate's Degree Correlation Chart
The statistical analysis conducted on geographies consisting of 261,343,960 people shows a poor negative correlation between the proportion of Slovenes and percentage of population with at least associate's degree education in the United States with a correlation coefficient (R) of -0.104 and weighted average of 47.9%. Similarly, the statistical analysis conducted on geographies consisting of 528,257,777 people shows a poor positive correlation between the proportion of Puerto Ricans and percentage of population with at least associate's degree education in the United States with a correlation coefficient (R) of 0.182 and weighted average of 40.4%, a difference of 18.6%.
Associate's Degree Correlation Summary
| Measurement | Slovene | Puerto Rican |
| Minimum | 9.0% | 7.5% |
| Maximum | 64.4% | 69.5% |
| Range | 55.4% | 61.9% |
| Mean | 42.0% | 35.6% |
| Median | 42.1% | 34.6% |
| Interquartile 25% (IQ1) | 35.8% | 28.7% |
| Interquartile 75% (IQ3) | 48.6% | 43.8% |
| Interquartile Range (IQR) | 12.8% | 15.1% |
| Standard Deviation (Sample) | 10.1% | 11.8% |
| Standard Deviation (Population) | 10.0% | 11.8% |
Similar Demographics by Associate's Degree
Demographics Similar to Slovenes by Associate's Degree
In terms of associate's degree, the demographic groups most similar to Slovenes are Immigrants from Southern Europe (47.8%, a difference of 0.090%), Taiwanese (47.7%, a difference of 0.24%), Sierra Leonean (47.7%, a difference of 0.30%), Polish (48.0%, a difference of 0.35%), and Immigrants from Eritrea (48.1%, a difference of 0.42%).
| Demographics | Rating | Rank | Associate's Degree |
| Immigrants | Albania | 89.9 /100 | #132 | Excellent 48.2% |
| Assyrians/Chaldeans/Syriacs | 89.4 /100 | #133 | Excellent 48.2% |
| Moroccans | 89.3 /100 | #134 | Excellent 48.2% |
| Europeans | 89.0 /100 | #135 | Excellent 48.2% |
| Pakistanis | 88.0 /100 | #136 | Excellent 48.1% |
| Immigrants | Eritrea | 87.8 /100 | #137 | Excellent 48.1% |
| Poles | 87.3 /100 | #138 | Excellent 48.0% |
| Slovenes | 85.1 /100 | #139 | Excellent 47.9% |
| Immigrants | Southern Europe | 84.4 /100 | #140 | Excellent 47.8% |
| Taiwanese | 83.3 /100 | #141 | Excellent 47.7% |
| Sierra Leoneans | 82.9 /100 | #142 | Excellent 47.7% |
| Norwegians | 81.0 /100 | #143 | Excellent 47.6% |
| Slavs | 80.5 /100 | #144 | Excellent 47.6% |
| Canadians | 79.0 /100 | #145 | Good 47.5% |
| Immigrants | Sudan | 77.9 /100 | #146 | Good 47.4% |
Demographics Similar to Puerto Ricans by Associate's Degree
In terms of associate's degree, the demographic groups most similar to Puerto Ricans are Blackfeet (40.3%, a difference of 0.050%), Potawatomi (40.4%, a difference of 0.10%), Ottawa (40.3%, a difference of 0.20%), Immigrants from Nicaragua (40.3%, a difference of 0.24%), and Immigrants from Dominica (40.5%, a difference of 0.25%).
| Demographics | Rating | Rank | Associate's Degree |
| Americans | 0.2 /100 | #269 | Tragic 40.8% |
| Chippewa | 0.2 /100 | #270 | Tragic 40.7% |
| Immigrants | Laos | 0.1 /100 | #271 | Tragic 40.7% |
| Belizeans | 0.1 /100 | #272 | Tragic 40.6% |
| Puget Sound Salish | 0.1 /100 | #273 | Tragic 40.5% |
| Immigrants | Dominica | 0.1 /100 | #274 | Tragic 40.5% |
| Potawatomi | 0.1 /100 | #275 | Tragic 40.4% |
| Puerto Ricans | 0.1 /100 | #276 | Tragic 40.4% |
| Blackfeet | 0.1 /100 | #277 | Tragic 40.3% |
| Ottawa | 0.1 /100 | #278 | Tragic 40.3% |
| Immigrants | Nicaragua | 0.1 /100 | #279 | Tragic 40.3% |
| Immigrants | Micronesia | 0.1 /100 | #280 | Tragic 40.2% |
| Immigrants | Portugal | 0.1 /100 | #281 | Tragic 40.1% |
| Bangladeshis | 0.1 /100 | #282 | Tragic 40.0% |
| Haitians | 0.1 /100 | #283 | Tragic 40.0% |