Dutch West Indian vs Puerto Rican Associate's Degree
COMPARE
Dutch West Indian
Puerto Rican
Associate's Degree
Associate's Degree Comparison
Dutch West Indians
Puerto Ricans
36.5%
ASSOCIATE'S DEGREE
0.0/ 100
METRIC RATING
327th/ 347
METRIC RANK
40.4%
ASSOCIATE'S DEGREE
0.1/ 100
METRIC RATING
276th/ 347
METRIC RANK
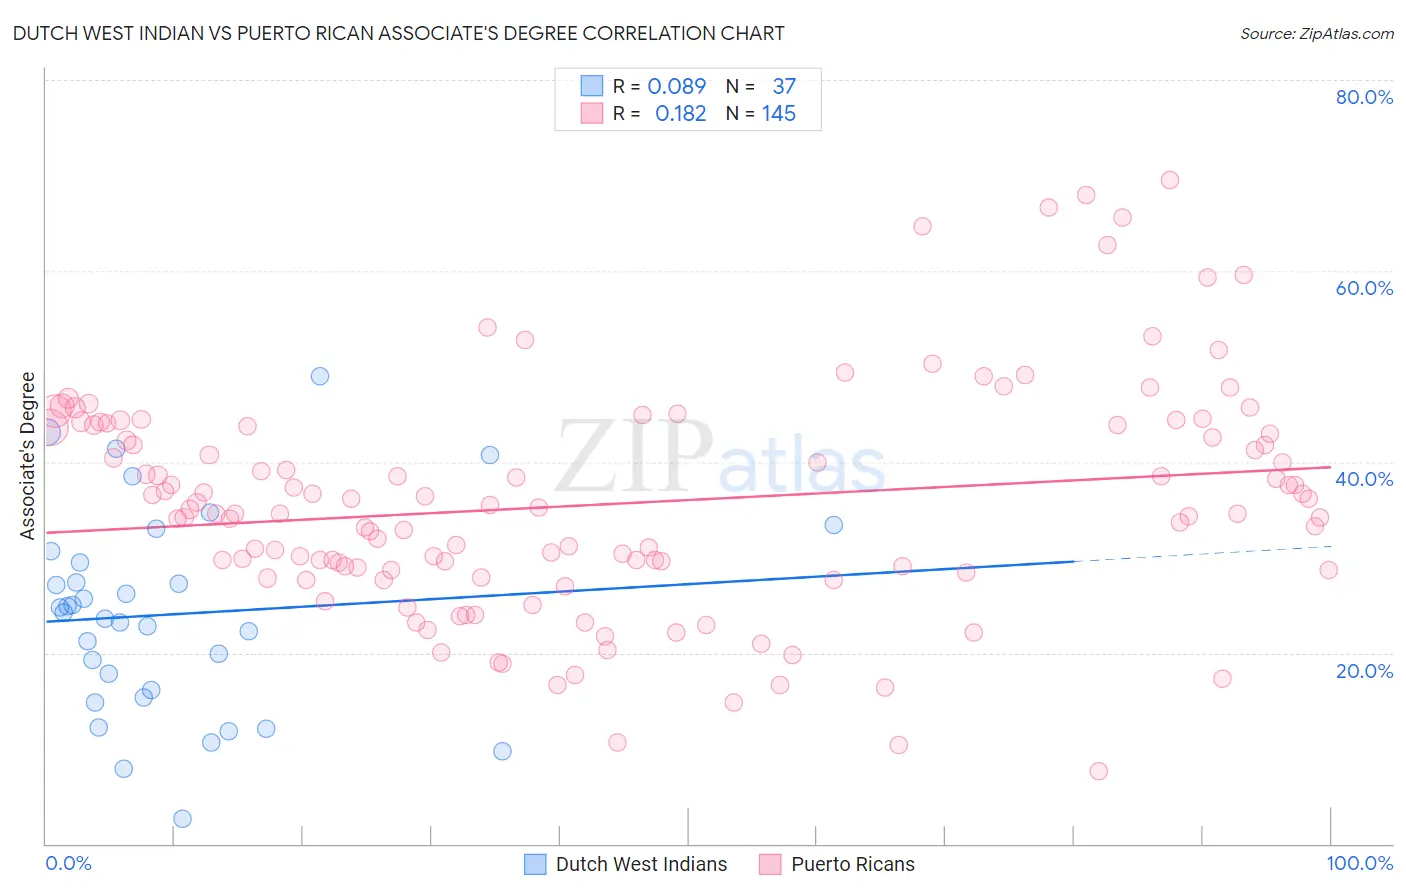
Dutch West Indian vs Puerto Rican Associate's Degree Correlation Chart
The statistical analysis conducted on geographies consisting of 85,775,630 people shows a slight positive correlation between the proportion of Dutch West Indians and percentage of population with at least associate's degree education in the United States with a correlation coefficient (R) of 0.089 and weighted average of 36.5%. Similarly, the statistical analysis conducted on geographies consisting of 528,257,777 people shows a poor positive correlation between the proportion of Puerto Ricans and percentage of population with at least associate's degree education in the United States with a correlation coefficient (R) of 0.182 and weighted average of 40.4%, a difference of 10.7%.
Associate's Degree Correlation Summary
| Measurement | Dutch West Indian | Puerto Rican |
| Minimum | 2.6% | 7.5% |
| Maximum | 49.0% | 69.5% |
| Range | 46.3% | 61.9% |
| Mean | 24.0% | 35.6% |
| Median | 24.3% | 34.6% |
| Interquartile 25% (IQ1) | 15.7% | 28.7% |
| Interquartile 75% (IQ3) | 30.1% | 43.8% |
| Interquartile Range (IQR) | 14.3% | 15.1% |
| Standard Deviation (Sample) | 10.6% | 11.8% |
| Standard Deviation (Population) | 10.4% | 11.8% |
Similar Demographics by Associate's Degree
Demographics Similar to Dutch West Indians by Associate's Degree
In terms of associate's degree, the demographic groups most similar to Dutch West Indians are Alaskan Athabascan (36.5%, a difference of 0.010%), Kiowa (36.5%, a difference of 0.020%), Paiute (36.4%, a difference of 0.30%), Menominee (36.7%, a difference of 0.58%), and Apache (36.2%, a difference of 0.61%).
| Demographics | Rating | Rank | Associate's Degree |
| Cajuns | 0.0 /100 | #320 | Tragic 37.4% |
| Immigrants | Yemen | 0.0 /100 | #321 | Tragic 37.3% |
| Pennsylvania Germans | 0.0 /100 | #322 | Tragic 37.2% |
| Immigrants | Cabo Verde | 0.0 /100 | #323 | Tragic 36.8% |
| Arapaho | 0.0 /100 | #324 | Tragic 36.7% |
| Menominee | 0.0 /100 | #325 | Tragic 36.7% |
| Kiowa | 0.0 /100 | #326 | Tragic 36.5% |
| Dutch West Indians | 0.0 /100 | #327 | Tragic 36.5% |
| Alaskan Athabascans | 0.0 /100 | #328 | Tragic 36.5% |
| Paiute | 0.0 /100 | #329 | Tragic 36.4% |
| Apache | 0.0 /100 | #330 | Tragic 36.2% |
| Immigrants | Azores | 0.0 /100 | #331 | Tragic 35.6% |
| Immigrants | Central America | 0.0 /100 | #332 | Tragic 35.0% |
| Mexicans | 0.0 /100 | #333 | Tragic 35.0% |
| Natives/Alaskans | 0.0 /100 | #334 | Tragic 34.9% |
Demographics Similar to Puerto Ricans by Associate's Degree
In terms of associate's degree, the demographic groups most similar to Puerto Ricans are Blackfeet (40.3%, a difference of 0.050%), Potawatomi (40.4%, a difference of 0.10%), Ottawa (40.3%, a difference of 0.20%), Immigrants from Nicaragua (40.3%, a difference of 0.24%), and Immigrants from Dominica (40.5%, a difference of 0.25%).
| Demographics | Rating | Rank | Associate's Degree |
| Americans | 0.2 /100 | #269 | Tragic 40.8% |
| Chippewa | 0.2 /100 | #270 | Tragic 40.7% |
| Immigrants | Laos | 0.1 /100 | #271 | Tragic 40.7% |
| Belizeans | 0.1 /100 | #272 | Tragic 40.6% |
| Puget Sound Salish | 0.1 /100 | #273 | Tragic 40.5% |
| Immigrants | Dominica | 0.1 /100 | #274 | Tragic 40.5% |
| Potawatomi | 0.1 /100 | #275 | Tragic 40.4% |
| Puerto Ricans | 0.1 /100 | #276 | Tragic 40.4% |
| Blackfeet | 0.1 /100 | #277 | Tragic 40.3% |
| Ottawa | 0.1 /100 | #278 | Tragic 40.3% |
| Immigrants | Nicaragua | 0.1 /100 | #279 | Tragic 40.3% |
| Immigrants | Micronesia | 0.1 /100 | #280 | Tragic 40.2% |
| Immigrants | Portugal | 0.1 /100 | #281 | Tragic 40.1% |
| Bangladeshis | 0.1 /100 | #282 | Tragic 40.0% |
| Haitians | 0.1 /100 | #283 | Tragic 40.0% |