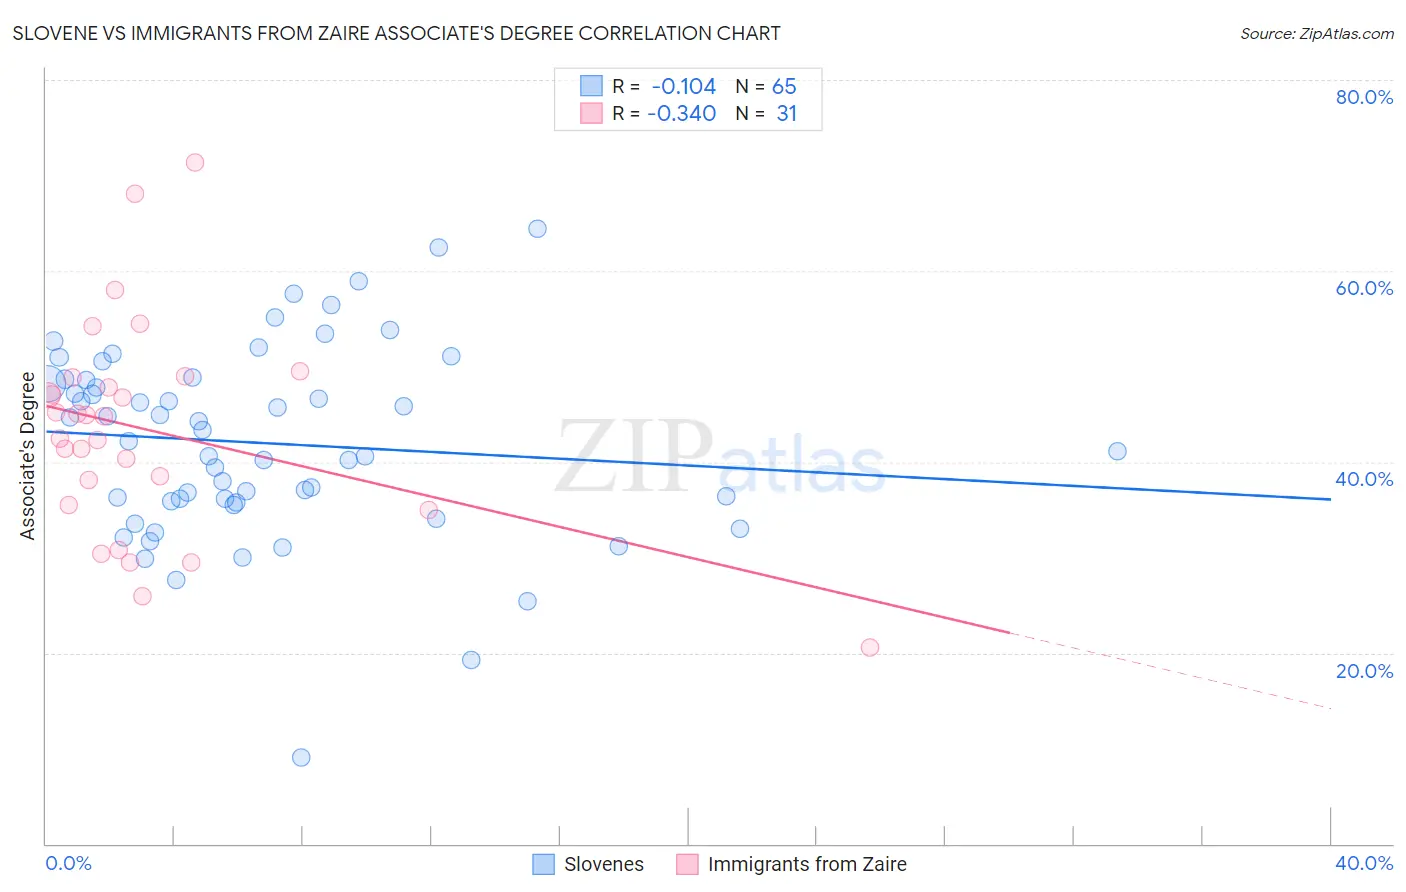
Slovene vs Immigrants from Zaire Associate's Degree
COMPARE
Slovene
Immigrants from Zaire
Associate's Degree
Associate's Degree Comparison
Slovenes
Immigrants from Zaire
47.9%
ASSOCIATE'S DEGREE
85.1/ 100
METRIC RATING
139th/ 347
METRIC RANK
45.0%
ASSOCIATE'S DEGREE
16.6/ 100
METRIC RATING
211th/ 347
METRIC RANK
Slovene vs Immigrants from Zaire Associate's Degree Correlation Chart
The statistical analysis conducted on geographies consisting of 261,343,960 people shows a poor negative correlation between the proportion of Slovenes and percentage of population with at least associate's degree education in the United States with a correlation coefficient (R) of -0.104 and weighted average of 47.9%. Similarly, the statistical analysis conducted on geographies consisting of 107,255,700 people shows a mild negative correlation between the proportion of Immigrants from Zaire and percentage of population with at least associate's degree education in the United States with a correlation coefficient (R) of -0.340 and weighted average of 45.0%, a difference of 6.5%.
Associate's Degree Correlation Summary
| Measurement | Slovene | Immigrants from Zaire |
| Minimum | 9.0% | 20.5% |
| Maximum | 64.4% | 71.3% |
| Range | 55.4% | 50.8% |
| Mean | 42.0% | 43.3% |
| Median | 42.1% | 44.8% |
| Interquartile 25% (IQ1) | 35.8% | 35.5% |
| Interquartile 75% (IQ3) | 48.6% | 48.8% |
| Interquartile Range (IQR) | 12.8% | 13.3% |
| Standard Deviation (Sample) | 10.1% | 11.2% |
| Standard Deviation (Population) | 10.0% | 11.0% |
Similar Demographics by Associate's Degree
Demographics Similar to Slovenes by Associate's Degree
In terms of associate's degree, the demographic groups most similar to Slovenes are Immigrants from Southern Europe (47.8%, a difference of 0.090%), Taiwanese (47.7%, a difference of 0.24%), Sierra Leonean (47.7%, a difference of 0.30%), Polish (48.0%, a difference of 0.35%), and Immigrants from Eritrea (48.1%, a difference of 0.42%).
| Demographics | Rating | Rank | Associate's Degree |
| Immigrants | Albania | 89.9 /100 | #132 | Excellent 48.2% |
| Assyrians/Chaldeans/Syriacs | 89.4 /100 | #133 | Excellent 48.2% |
| Moroccans | 89.3 /100 | #134 | Excellent 48.2% |
| Europeans | 89.0 /100 | #135 | Excellent 48.2% |
| Pakistanis | 88.0 /100 | #136 | Excellent 48.1% |
| Immigrants | Eritrea | 87.8 /100 | #137 | Excellent 48.1% |
| Poles | 87.3 /100 | #138 | Excellent 48.0% |
| Slovenes | 85.1 /100 | #139 | Excellent 47.9% |
| Immigrants | Southern Europe | 84.4 /100 | #140 | Excellent 47.8% |
| Taiwanese | 83.3 /100 | #141 | Excellent 47.7% |
| Sierra Leoneans | 82.9 /100 | #142 | Excellent 47.7% |
| Norwegians | 81.0 /100 | #143 | Excellent 47.6% |
| Slavs | 80.5 /100 | #144 | Excellent 47.6% |
| Canadians | 79.0 /100 | #145 | Good 47.5% |
| Immigrants | Sudan | 77.9 /100 | #146 | Good 47.4% |
Demographics Similar to Immigrants from Zaire by Associate's Degree
In terms of associate's degree, the demographic groups most similar to Immigrants from Zaire are Immigrants from Costa Rica (45.0%, a difference of 0.010%), Immigrants from Philippines (45.0%, a difference of 0.010%), Dutch (45.0%, a difference of 0.13%), Panamanian (45.1%, a difference of 0.23%), and French Canadian (44.9%, a difference of 0.23%).
| Demographics | Rating | Rank | Associate's Degree |
| Nigerians | 19.1 /100 | #204 | Poor 45.1% |
| Immigrants | Thailand | 18.9 /100 | #205 | Poor 45.1% |
| German Russians | 18.9 /100 | #206 | Poor 45.1% |
| Panamanians | 18.4 /100 | #207 | Poor 45.1% |
| Dutch | 17.6 /100 | #208 | Poor 45.0% |
| Immigrants | Costa Rica | 16.7 /100 | #209 | Poor 45.0% |
| Immigrants | Philippines | 16.7 /100 | #210 | Poor 45.0% |
| Immigrants | Zaire | 16.6 /100 | #211 | Poor 45.0% |
| French Canadians | 15.0 /100 | #212 | Poor 44.9% |
| Immigrants | Ghana | 14.2 /100 | #213 | Poor 44.8% |
| Immigrants | Middle Africa | 12.7 /100 | #214 | Poor 44.7% |
| Immigrants | Panama | 12.4 /100 | #215 | Poor 44.7% |
| Immigrants | Nigeria | 11.4 /100 | #216 | Poor 44.6% |
| Immigrants | Immigrants | 10.5 /100 | #217 | Poor 44.5% |
| Spanish | 9.4 /100 | #218 | Tragic 44.4% |