Sioux vs American Professional Degree
COMPARE
Sioux
American
Professional Degree
Professional Degree Comparison
Sioux
Americans
3.3%
PROFESSIONAL DEGREE
0.1/ 100
METRIC RATING
312th/ 347
METRIC RANK
3.6%
PROFESSIONAL DEGREE
0.5/ 100
METRIC RATING
273rd/ 347
METRIC RANK
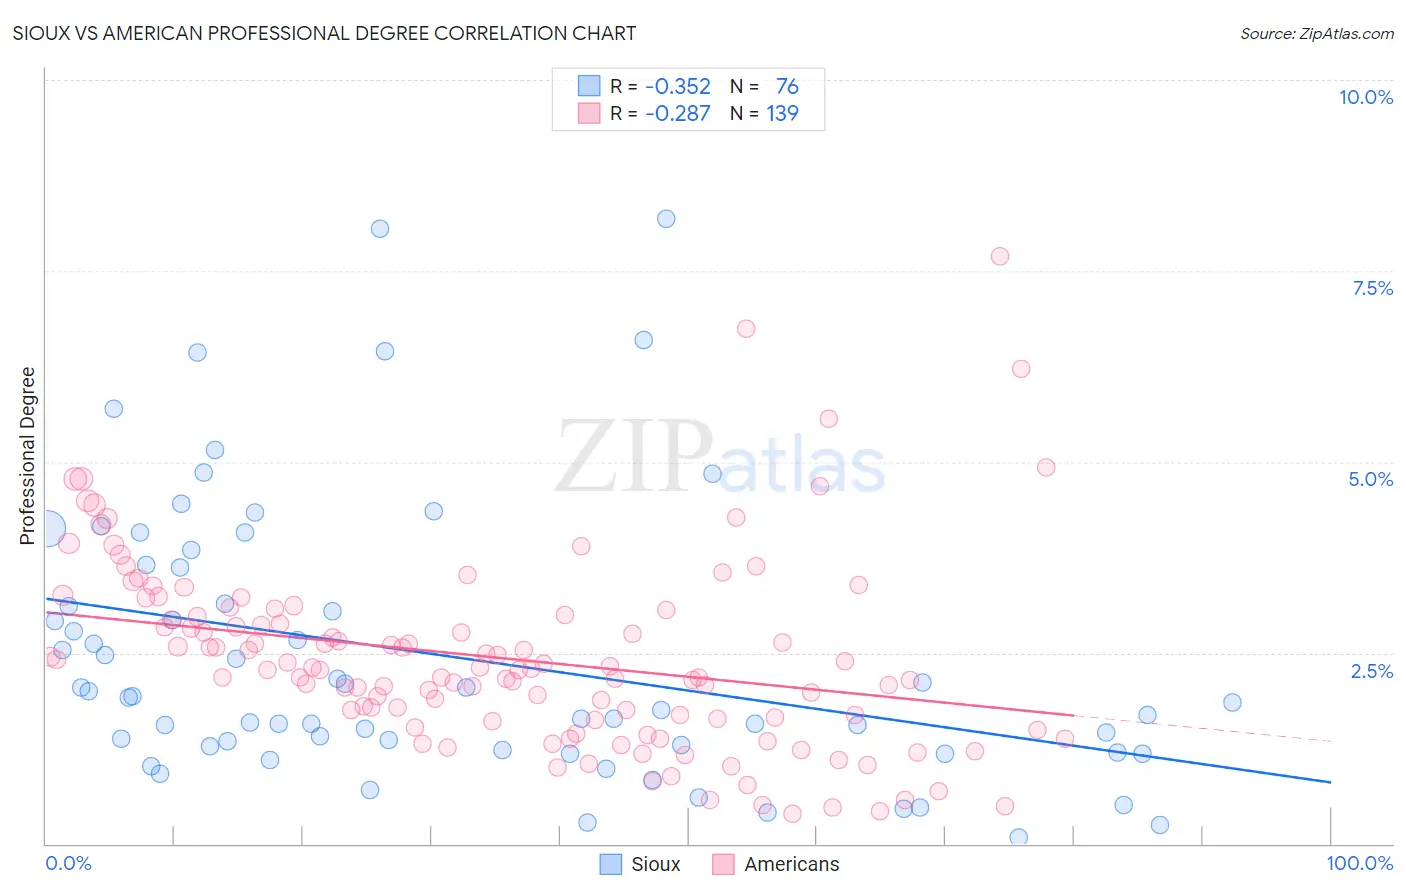
Sioux vs American Professional Degree Correlation Chart
The statistical analysis conducted on geographies consisting of 233,329,443 people shows a mild negative correlation between the proportion of Sioux and percentage of population with at least professional degree education in the United States with a correlation coefficient (R) of -0.352 and weighted average of 3.3%. Similarly, the statistical analysis conducted on geographies consisting of 570,969,920 people shows a weak negative correlation between the proportion of Americans and percentage of population with at least professional degree education in the United States with a correlation coefficient (R) of -0.287 and weighted average of 3.6%, a difference of 8.9%.
Professional Degree Correlation Summary
| Measurement | Sioux | American |
| Minimum | 0.086% | 0.39% |
| Maximum | 8.2% | 7.7% |
| Range | 8.1% | 7.3% |
| Mean | 2.5% | 2.4% |
| Median | 1.9% | 2.3% |
| Interquartile 25% (IQ1) | 1.2% | 1.6% |
| Interquartile 75% (IQ3) | 3.4% | 3.0% |
| Interquartile Range (IQR) | 2.1% | 1.4% |
| Standard Deviation (Sample) | 1.8% | 1.2% |
| Standard Deviation (Population) | 1.8% | 1.2% |
Similar Demographics by Professional Degree
Demographics Similar to Sioux by Professional Degree
In terms of professional degree, the demographic groups most similar to Sioux are Yuman (3.3%, a difference of 0.010%), Mexican American Indian (3.3%, a difference of 0.23%), Cherokee (3.3%, a difference of 0.59%), Immigrants from Latin America (3.3%, a difference of 0.75%), and Immigrants from Laos (3.2%, a difference of 0.91%).
| Demographics | Rating | Rank | Professional Degree |
| Chickasaw | 0.1 /100 | #305 | Tragic 3.4% |
| Cape Verdeans | 0.1 /100 | #306 | Tragic 3.4% |
| Samoans | 0.1 /100 | #307 | Tragic 3.3% |
| Shoshone | 0.1 /100 | #308 | Tragic 3.3% |
| Pima | 0.1 /100 | #309 | Tragic 3.3% |
| Immigrants | Latin America | 0.1 /100 | #310 | Tragic 3.3% |
| Cherokee | 0.1 /100 | #311 | Tragic 3.3% |
| Sioux | 0.1 /100 | #312 | Tragic 3.3% |
| Yuman | 0.1 /100 | #313 | Tragic 3.3% |
| Mexican American Indians | 0.1 /100 | #314 | Tragic 3.3% |
| Immigrants | Laos | 0.1 /100 | #315 | Tragic 3.2% |
| Puerto Ricans | 0.1 /100 | #316 | Tragic 3.2% |
| Nepalese | 0.1 /100 | #317 | Tragic 3.2% |
| Immigrants | Micronesia | 0.1 /100 | #318 | Tragic 3.2% |
| Choctaw | 0.1 /100 | #319 | Tragic 3.2% |
Demographics Similar to Americans by Professional Degree
In terms of professional degree, the demographic groups most similar to Americans are Immigrants from Jamaica (3.6%, a difference of 0.060%), Belizean (3.6%, a difference of 0.090%), Potawatomi (3.6%, a difference of 0.13%), Immigrants from Dominica (3.6%, a difference of 0.35%), and Liberian (3.6%, a difference of 0.40%).
| Demographics | Rating | Rank | Professional Degree |
| Central American Indians | 0.8 /100 | #266 | Tragic 3.6% |
| Delaware | 0.7 /100 | #267 | Tragic 3.6% |
| Aleuts | 0.7 /100 | #268 | Tragic 3.6% |
| Immigrants | Cuba | 0.6 /100 | #269 | Tragic 3.6% |
| Central Americans | 0.6 /100 | #270 | Tragic 3.6% |
| Belizeans | 0.5 /100 | #271 | Tragic 3.6% |
| Immigrants | Jamaica | 0.5 /100 | #272 | Tragic 3.6% |
| Americans | 0.5 /100 | #273 | Tragic 3.6% |
| Potawatomi | 0.5 /100 | #274 | Tragic 3.6% |
| Immigrants | Dominica | 0.5 /100 | #275 | Tragic 3.6% |
| Liberians | 0.5 /100 | #276 | Tragic 3.6% |
| Cheyenne | 0.5 /100 | #277 | Tragic 3.6% |
| Japanese | 0.5 /100 | #278 | Tragic 3.5% |
| Immigrants | Portugal | 0.5 /100 | #279 | Tragic 3.5% |
| Dominicans | 0.5 /100 | #280 | Tragic 3.5% |