Sioux vs Assyrian/Chaldean/Syriac Professional Degree
COMPARE
Sioux
Assyrian/Chaldean/Syriac
Professional Degree
Professional Degree Comparison
Sioux
Assyrians/Chaldeans/Syriacs
3.3%
PROFESSIONAL DEGREE
0.1/ 100
METRIC RATING
312th/ 347
METRIC RANK
4.5%
PROFESSIONAL DEGREE
67.4/ 100
METRIC RATING
161st/ 347
METRIC RANK
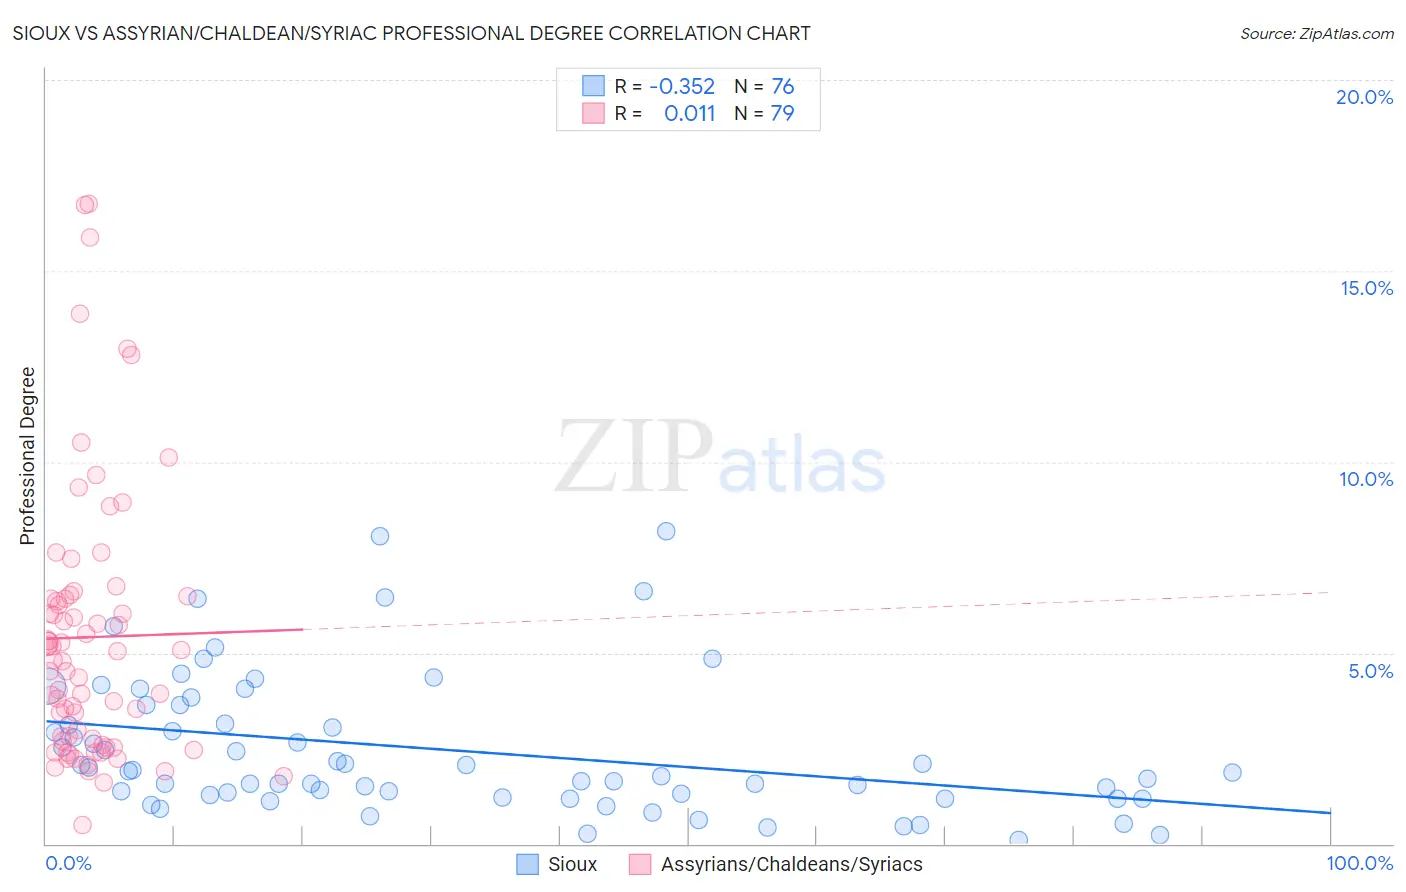
Sioux vs Assyrian/Chaldean/Syriac Professional Degree Correlation Chart
The statistical analysis conducted on geographies consisting of 233,329,443 people shows a mild negative correlation between the proportion of Sioux and percentage of population with at least professional degree education in the United States with a correlation coefficient (R) of -0.352 and weighted average of 3.3%. Similarly, the statistical analysis conducted on geographies consisting of 110,257,052 people shows no correlation between the proportion of Assyrians/Chaldeans/Syriacs and percentage of population with at least professional degree education in the United States with a correlation coefficient (R) of 0.011 and weighted average of 4.5%, a difference of 38.1%.
Professional Degree Correlation Summary
| Measurement | Sioux | Assyrian/Chaldean/Syriac |
| Minimum | 0.086% | 0.50% |
| Maximum | 8.2% | 16.8% |
| Range | 8.1% | 16.3% |
| Mean | 2.5% | 5.4% |
| Median | 1.9% | 4.8% |
| Interquartile 25% (IQ1) | 1.2% | 2.7% |
| Interquartile 75% (IQ3) | 3.4% | 6.4% |
| Interquartile Range (IQR) | 2.1% | 3.7% |
| Standard Deviation (Sample) | 1.8% | 3.5% |
| Standard Deviation (Population) | 1.8% | 3.5% |
Similar Demographics by Professional Degree
Demographics Similar to Sioux by Professional Degree
In terms of professional degree, the demographic groups most similar to Sioux are Yuman (3.3%, a difference of 0.010%), Mexican American Indian (3.3%, a difference of 0.23%), Cherokee (3.3%, a difference of 0.59%), Immigrants from Latin America (3.3%, a difference of 0.75%), and Immigrants from Laos (3.2%, a difference of 0.91%).
| Demographics | Rating | Rank | Professional Degree |
| Chickasaw | 0.1 /100 | #305 | Tragic 3.4% |
| Cape Verdeans | 0.1 /100 | #306 | Tragic 3.4% |
| Samoans | 0.1 /100 | #307 | Tragic 3.3% |
| Shoshone | 0.1 /100 | #308 | Tragic 3.3% |
| Pima | 0.1 /100 | #309 | Tragic 3.3% |
| Immigrants | Latin America | 0.1 /100 | #310 | Tragic 3.3% |
| Cherokee | 0.1 /100 | #311 | Tragic 3.3% |
| Sioux | 0.1 /100 | #312 | Tragic 3.3% |
| Yuman | 0.1 /100 | #313 | Tragic 3.3% |
| Mexican American Indians | 0.1 /100 | #314 | Tragic 3.3% |
| Immigrants | Laos | 0.1 /100 | #315 | Tragic 3.2% |
| Puerto Ricans | 0.1 /100 | #316 | Tragic 3.2% |
| Nepalese | 0.1 /100 | #317 | Tragic 3.2% |
| Immigrants | Micronesia | 0.1 /100 | #318 | Tragic 3.2% |
| Choctaw | 0.1 /100 | #319 | Tragic 3.2% |
Demographics Similar to Assyrians/Chaldeans/Syriacs by Professional Degree
In terms of professional degree, the demographic groups most similar to Assyrians/Chaldeans/Syriacs are Immigrants from Senegal (4.5%, a difference of 0.10%), Vietnamese (4.5%, a difference of 0.16%), Immigrants from Armenia (4.5%, a difference of 0.24%), Peruvian (4.5%, a difference of 0.34%), and Iraqi (4.5%, a difference of 0.41%).
| Demographics | Rating | Rank | Professional Degree |
| Scottish | 71.8 /100 | #154 | Good 4.6% |
| Slavs | 70.8 /100 | #155 | Good 4.5% |
| Swedes | 69.9 /100 | #156 | Good 4.5% |
| Iraqis | 69.8 /100 | #157 | Good 4.5% |
| Immigrants | Armenia | 68.8 /100 | #158 | Good 4.5% |
| Vietnamese | 68.4 /100 | #159 | Good 4.5% |
| Immigrants | Senegal | 68.0 /100 | #160 | Good 4.5% |
| Assyrians/Chaldeans/Syriacs | 67.4 /100 | #161 | Good 4.5% |
| Peruvians | 65.2 /100 | #162 | Good 4.5% |
| Sierra Leoneans | 64.3 /100 | #163 | Good 4.5% |
| Swiss | 61.0 /100 | #164 | Good 4.5% |
| Costa Ricans | 59.9 /100 | #165 | Average 4.5% |
| Immigrants | Colombia | 59.4 /100 | #166 | Average 4.5% |
| Immigrants | Afghanistan | 59.2 /100 | #167 | Average 4.5% |
| Immigrants | Sierra Leone | 58.7 /100 | #168 | Average 4.5% |