Yaqui vs American Professional Degree
COMPARE
Yaqui
American
Professional Degree
Professional Degree Comparison
Yaqui
Americans
3.2%
PROFESSIONAL DEGREE
0.0/ 100
METRIC RATING
325th/ 347
METRIC RANK
3.6%
PROFESSIONAL DEGREE
0.5/ 100
METRIC RATING
273rd/ 347
METRIC RANK
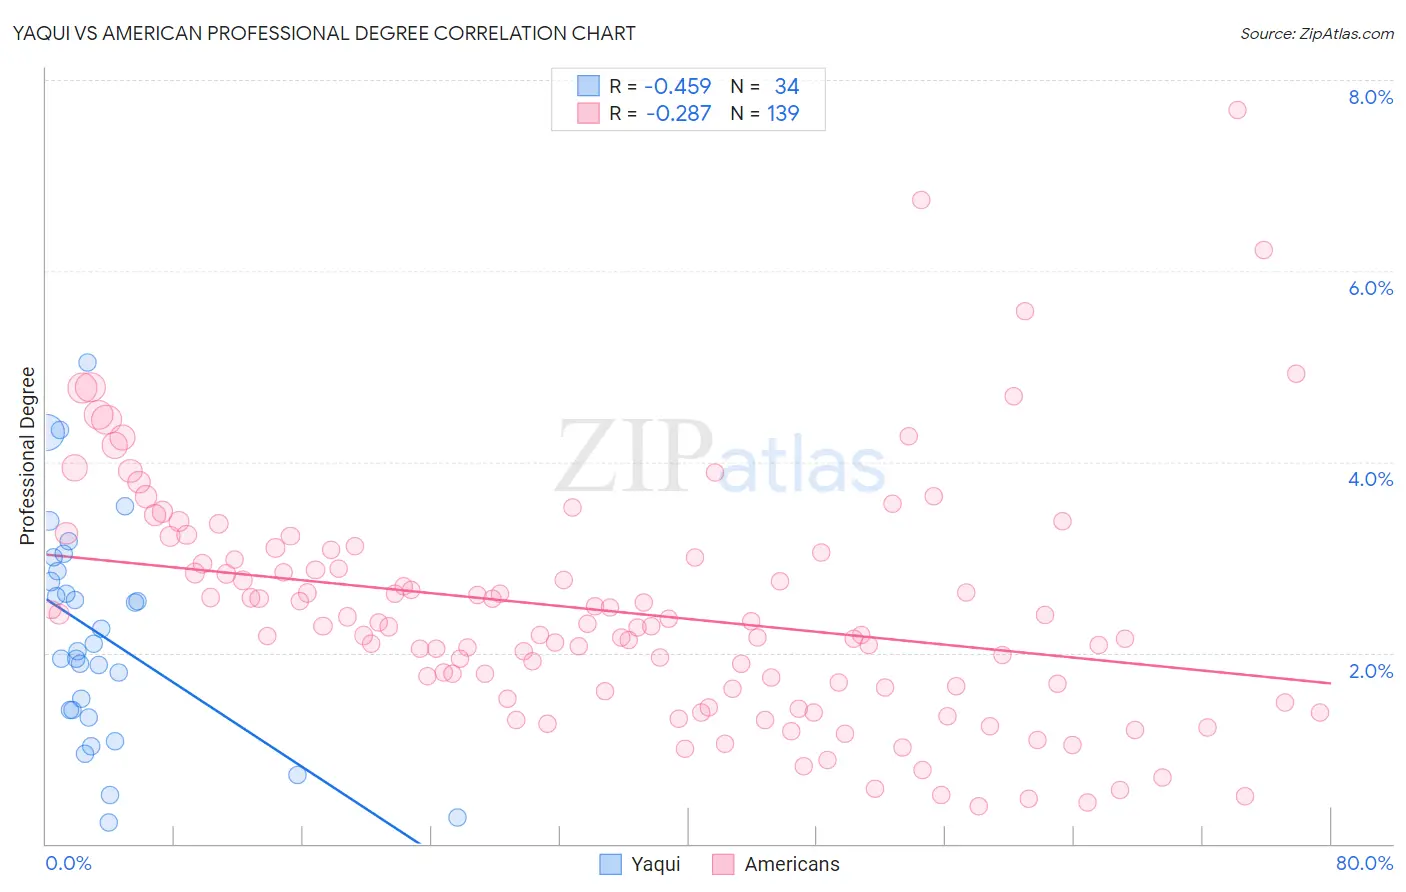
Yaqui vs American Professional Degree Correlation Chart
The statistical analysis conducted on geographies consisting of 107,544,559 people shows a moderate negative correlation between the proportion of Yaqui and percentage of population with at least professional degree education in the United States with a correlation coefficient (R) of -0.459 and weighted average of 3.2%. Similarly, the statistical analysis conducted on geographies consisting of 570,969,920 people shows a weak negative correlation between the proportion of Americans and percentage of population with at least professional degree education in the United States with a correlation coefficient (R) of -0.287 and weighted average of 3.6%, a difference of 13.0%.
Professional Degree Correlation Summary
| Measurement | Yaqui | American |
| Minimum | 0.22% | 0.39% |
| Maximum | 5.0% | 7.7% |
| Range | 4.8% | 7.3% |
| Mean | 2.2% | 2.4% |
| Median | 2.1% | 2.3% |
| Interquartile 25% (IQ1) | 1.4% | 1.6% |
| Interquartile 75% (IQ3) | 2.9% | 3.0% |
| Interquartile Range (IQR) | 1.5% | 1.4% |
| Standard Deviation (Sample) | 1.2% | 1.2% |
| Standard Deviation (Population) | 1.1% | 1.2% |
Similar Demographics by Professional Degree
Demographics Similar to Yaqui by Professional Degree
In terms of professional degree, the demographic groups most similar to Yaqui are Crow (3.2%, a difference of 0.060%), Inupiat (3.2%, a difference of 0.34%), Hispanic or Latino (3.2%, a difference of 0.42%), Tsimshian (3.2%, a difference of 0.78%), and Seminole (3.2%, a difference of 1.1%).
| Demographics | Rating | Rank | Professional Degree |
| Immigrants | Micronesia | 0.1 /100 | #318 | Tragic 3.2% |
| Choctaw | 0.1 /100 | #319 | Tragic 3.2% |
| Seminole | 0.1 /100 | #320 | Tragic 3.2% |
| Tsimshian | 0.0 /100 | #321 | Tragic 3.2% |
| Hispanics or Latinos | 0.0 /100 | #322 | Tragic 3.2% |
| Inupiat | 0.0 /100 | #323 | Tragic 3.2% |
| Crow | 0.0 /100 | #324 | Tragic 3.2% |
| Yaqui | 0.0 /100 | #325 | Tragic 3.2% |
| Menominee | 0.0 /100 | #326 | Tragic 3.1% |
| Dutch West Indians | 0.0 /100 | #327 | Tragic 3.1% |
| Creek | 0.0 /100 | #328 | Tragic 3.1% |
| Bangladeshis | 0.0 /100 | #329 | Tragic 3.1% |
| Immigrants | Cabo Verde | 0.0 /100 | #330 | Tragic 3.1% |
| Kiowa | 0.0 /100 | #331 | Tragic 3.1% |
| Yakama | 0.0 /100 | #332 | Tragic 3.1% |
Demographics Similar to Americans by Professional Degree
In terms of professional degree, the demographic groups most similar to Americans are Immigrants from Jamaica (3.6%, a difference of 0.060%), Belizean (3.6%, a difference of 0.090%), Potawatomi (3.6%, a difference of 0.13%), Immigrants from Dominica (3.6%, a difference of 0.35%), and Liberian (3.6%, a difference of 0.40%).
| Demographics | Rating | Rank | Professional Degree |
| Central American Indians | 0.8 /100 | #266 | Tragic 3.6% |
| Delaware | 0.7 /100 | #267 | Tragic 3.6% |
| Aleuts | 0.7 /100 | #268 | Tragic 3.6% |
| Immigrants | Cuba | 0.6 /100 | #269 | Tragic 3.6% |
| Central Americans | 0.6 /100 | #270 | Tragic 3.6% |
| Belizeans | 0.5 /100 | #271 | Tragic 3.6% |
| Immigrants | Jamaica | 0.5 /100 | #272 | Tragic 3.6% |
| Americans | 0.5 /100 | #273 | Tragic 3.6% |
| Potawatomi | 0.5 /100 | #274 | Tragic 3.6% |
| Immigrants | Dominica | 0.5 /100 | #275 | Tragic 3.6% |
| Liberians | 0.5 /100 | #276 | Tragic 3.6% |
| Cheyenne | 0.5 /100 | #277 | Tragic 3.6% |
| Japanese | 0.5 /100 | #278 | Tragic 3.5% |
| Immigrants | Portugal | 0.5 /100 | #279 | Tragic 3.5% |
| Dominicans | 0.5 /100 | #280 | Tragic 3.5% |