Puerto Rican vs Immigrants from Czechoslovakia Doctorate Degree
COMPARE
Puerto Rican
Immigrants from Czechoslovakia
Doctorate Degree
Doctorate Degree Comparison
Puerto Ricans
Immigrants from Czechoslovakia
1.4%
DOCTORATE DEGREE
0.1/ 100
METRIC RATING
298th/ 347
METRIC RANK
2.4%
DOCTORATE DEGREE
100.0/ 100
METRIC RATING
56th/ 347
METRIC RANK
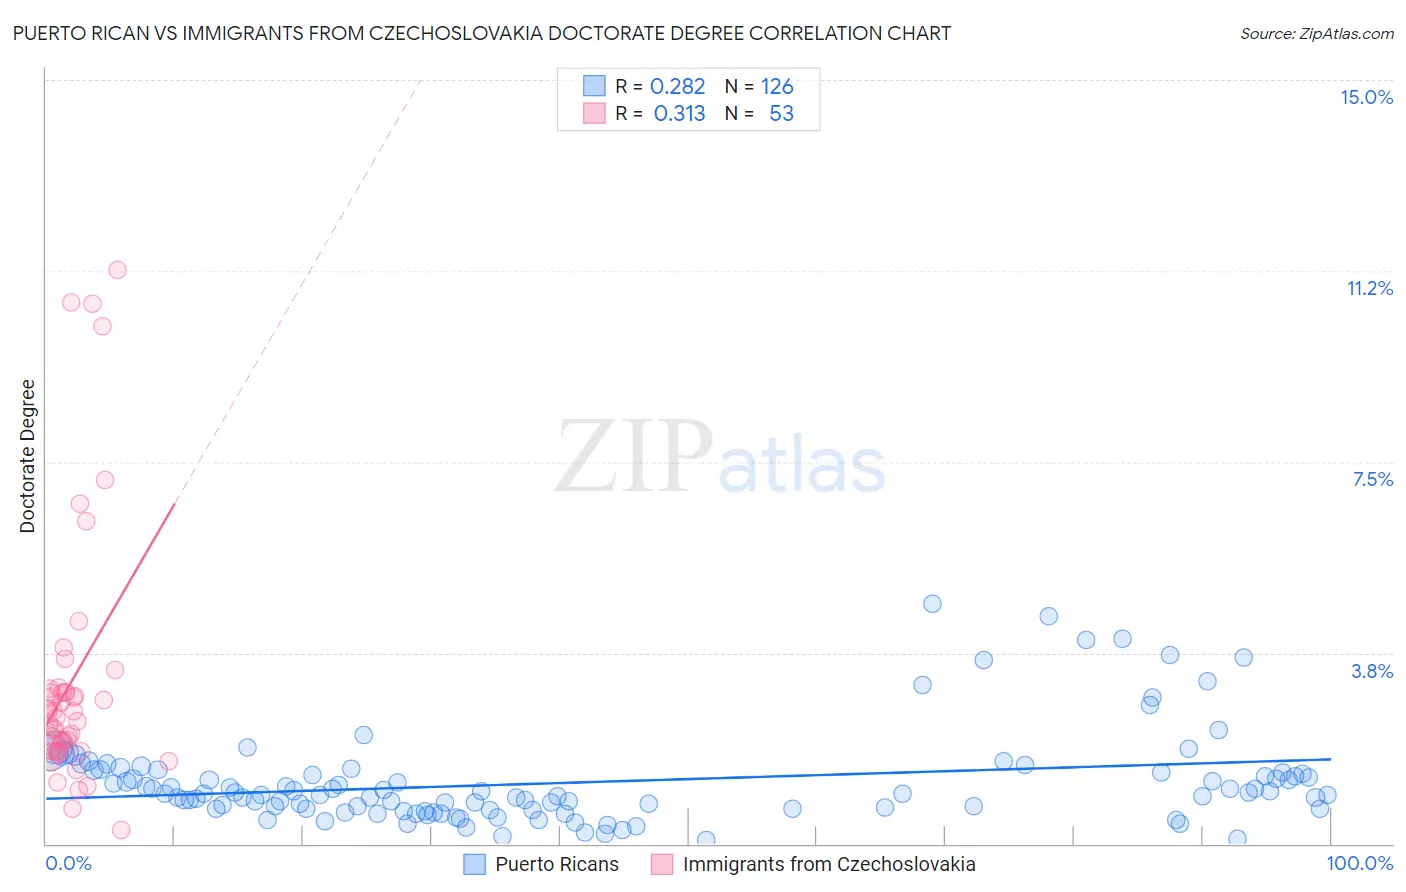
Puerto Rican vs Immigrants from Czechoslovakia Doctorate Degree Correlation Chart
The statistical analysis conducted on geographies consisting of 514,802,619 people shows a weak positive correlation between the proportion of Puerto Ricans and percentage of population with at least doctorate degree education in the United States with a correlation coefficient (R) of 0.282 and weighted average of 1.4%. Similarly, the statistical analysis conducted on geographies consisting of 195,016,936 people shows a mild positive correlation between the proportion of Immigrants from Czechoslovakia and percentage of population with at least doctorate degree education in the United States with a correlation coefficient (R) of 0.313 and weighted average of 2.4%, a difference of 68.8%.
Doctorate Degree Correlation Summary
| Measurement | Puerto Rican | Immigrants from Czechoslovakia |
| Minimum | 0.063% | 0.28% |
| Maximum | 4.7% | 11.3% |
| Range | 4.7% | 11.0% |
| Mean | 1.2% | 3.2% |
| Median | 0.99% | 2.5% |
| Interquartile 25% (IQ1) | 0.69% | 1.8% |
| Interquartile 75% (IQ3) | 1.4% | 3.0% |
| Interquartile Range (IQR) | 0.71% | 1.2% |
| Standard Deviation (Sample) | 0.89% | 2.5% |
| Standard Deviation (Population) | 0.89% | 2.5% |
Similar Demographics by Doctorate Degree
Demographics Similar to Puerto Ricans by Doctorate Degree
In terms of doctorate degree, the demographic groups most similar to Puerto Ricans are Tsimshian (1.4%, a difference of 0.41%), Belizean (1.4%, a difference of 0.43%), Immigrants from Ecuador (1.4%, a difference of 0.63%), Immigrants from Guatemala (1.4%, a difference of 0.76%), and Honduran (1.4%, a difference of 0.83%).
| Demographics | Rating | Rank | Doctorate Degree |
| Blacks/African Americans | 0.3 /100 | #291 | Tragic 1.4% |
| Alaska Natives | 0.3 /100 | #292 | Tragic 1.4% |
| Immigrants | Yemen | 0.2 /100 | #293 | Tragic 1.4% |
| Samoans | 0.2 /100 | #294 | Tragic 1.4% |
| Guatemalans | 0.2 /100 | #295 | Tragic 1.4% |
| Immigrants | Ecuador | 0.2 /100 | #296 | Tragic 1.4% |
| Tsimshian | 0.2 /100 | #297 | Tragic 1.4% |
| Puerto Ricans | 0.1 /100 | #298 | Tragic 1.4% |
| Belizeans | 0.1 /100 | #299 | Tragic 1.4% |
| Immigrants | Guatemala | 0.1 /100 | #300 | Tragic 1.4% |
| Hondurans | 0.1 /100 | #301 | Tragic 1.4% |
| Shoshone | 0.1 /100 | #302 | Tragic 1.4% |
| Immigrants | Dominica | 0.1 /100 | #303 | Tragic 1.4% |
| Mexican American Indians | 0.1 /100 | #304 | Tragic 1.4% |
| Pennsylvania Germans | 0.1 /100 | #305 | Tragic 1.4% |
Demographics Similar to Immigrants from Czechoslovakia by Doctorate Degree
In terms of doctorate degree, the demographic groups most similar to Immigrants from Czechoslovakia are Bolivian (2.4%, a difference of 0.090%), Immigrants from Indonesia (2.4%, a difference of 0.17%), Immigrants from Ethiopia (2.4%, a difference of 0.44%), Ethiopian (2.3%, a difference of 0.55%), and Immigrants from Latvia (2.4%, a difference of 0.85%).
| Demographics | Rating | Rank | Doctorate Degree |
| Immigrants | Asia | 100.0 /100 | #49 | Exceptional 2.4% |
| Immigrants | Norway | 100.0 /100 | #50 | Exceptional 2.4% |
| Australians | 100.0 /100 | #51 | Exceptional 2.4% |
| Bulgarians | 100.0 /100 | #52 | Exceptional 2.4% |
| Immigrants | Latvia | 100.0 /100 | #53 | Exceptional 2.4% |
| Immigrants | Indonesia | 100.0 /100 | #54 | Exceptional 2.4% |
| Bolivians | 100.0 /100 | #55 | Exceptional 2.4% |
| Immigrants | Czechoslovakia | 100.0 /100 | #56 | Exceptional 2.4% |
| Immigrants | Ethiopia | 100.0 /100 | #57 | Exceptional 2.4% |
| Ethiopians | 99.9 /100 | #58 | Exceptional 2.3% |
| South Africans | 99.9 /100 | #59 | Exceptional 2.3% |
| Immigrants | Serbia | 99.9 /100 | #60 | Exceptional 2.3% |
| Bhutanese | 99.9 /100 | #61 | Exceptional 2.3% |
| Immigrants | Europe | 99.9 /100 | #62 | Exceptional 2.3% |
| Laotians | 99.9 /100 | #63 | Exceptional 2.3% |