Puerto Rican vs Immigrants from Czechoslovakia Kindergarten

COMPARE

Puerto Rican
Race
Ancestry
AfghanAfricanAlaska NativeAlaskan AthabascanAlbanianAleutAlsatianAmericanApacheArabArapahoArgentineanArmenianAssyrian/Chaldean/SyriacAustralianAustrianBahamianBangladeshiBarbadianBasqueBelgianBelizeanBermudanBhutaneseBlackfeetBolivianBrazilianBritishBritish West IndianBulgarianBurmeseCajunCambodianCanadianCape VerdeanCarpatho RusynCelticCentral AmericanCentral American IndianCherokeeCheyenneChickasawChileanChineseChippewaChoctawColombianColvilleComancheCosta RicanCreeCreekCroatianCrowCubanCypriotCzechCzechoslovakianDanishDelawareDominicanDutchDutch West IndianEastern EuropeanEcuadorianEgyptianEnglishEstonianEthiopianEuropeanFijianFilipinoFinnishFrenchFrench American IndianFrench CanadianGermanGerman RussianGhanaianGreekGuamanian/ChamorroGuatemalanGuyaneseHaitianHmongHonduranHopiHoumaHungarianIcelanderIndian (Asian)IndonesianInupiatIranianIraqiIrishIroquoisIsraeliItalianJamaicanJapaneseJordanianKenyanKiowaKoreanLaotianLatvianLebaneseLiberianLithuanianLumbeeLuxembourgerMacedonianMalaysianMalteseMarshalleseMenomineeMexicanMexican American IndianMongolianMoroccanNative HawaiianNavajoNepaleseNew ZealanderNicaraguanNigerianNorthern EuropeanNorwegianOkinawanOsageOttawaPaiutePakistaniPalestinianPanamanianParaguayanPennsylvania GermanPeruvianPimaPolishPortuguesePotawatomiPuebloPuerto RicanPuget Sound SalishRomanianRussianSalvadoranSamoanScandinavianScotch-IrishScottishSeminoleSenegaleseSerbianShoshoneSierra LeoneanSiouxSlavicSlovakSloveneSomaliSouth AfricanSouth AmericanSouth American IndianSoviet UnionSpaniardSpanishSpanish AmericanSpanish American IndianSri LankanSubsaharan AfricanSudaneseSwedishSwissSyrianTaiwaneseThaiTlingit-HaidaTohono O'OdhamTonganTrinidadian and TobagonianTsimshianTurkishU.S. Virgin IslanderUgandanUkrainianUruguayanUteVenezuelanVietnameseWelshWest IndianYakamaYaquiYugoslavianYumanYup'ikZimbabwean
Immigration
NonimmigrantsImmigrantsAfghanistanAfricaAlbaniaArgentinaArmeniaAsiaAustraliaAustriaBahamasBangladeshBarbadosBelarusBelgiumBelizeBoliviaBosnia and HerzegovinaBrazilBulgariaBurma/MyanmarCabo VerdeCambodiaCameroonCanadaCaribbeanCentral AmericaChileChinaColombiaCongoCosta RicaCroatiaCubaDenmarkDominicaDominican RepublicEastern AfricaEastern AsiaEastern EuropeEcuadorEgyptEl SalvadorEnglandEritreaEthiopiaEuropeFijiFranceGermanyGhanaGreeceGrenadaGuatemalaGuyanaHaitiHondurasHong KongHungaryIndiaIndonesiaIranIraqIrelandIsraelItalyJamaicaJapanJordanKazakhstanKenyaKoreaKuwaitLaosLatin AmericaLatviaLebanonLiberiaLithuaniaMalaysiaMexicoMicronesiaMiddle AfricaMoldovaMoroccoNepalNetherlandsNicaraguaNigeriaNorth AmericaNorth MacedoniaNorthern AfricaNorthern EuropeNorwayOceaniaPakistanPanamaPeruPhilippinesPolandPortugalRomaniaRussiaSaudi ArabiaScotlandSenegalSerbiaSierra LeoneSingaporeSomaliaSouth AfricaSouth AmericaSouth Central AsiaSouth Eastern AsiaSouthern EuropeSpainSri LankaSt. Vincent and the GrenadinesSudanSwedenSwitzerlandSyriaTaiwanThailandTrinidad and TobagoTurkeyUgandaUkraineUruguayUzbekistanVenezuelaVietnamWest IndiesWestern AfricaWestern AsiaWestern EuropeYemenZaireZimbabweAzores
Immigrants from Czechoslovakia
Race
Ancestry
AfghanAfricanAlaska NativeAlaskan AthabascanAlbanianAleutAlsatianAmericanApacheArabArapahoArgentineanArmenianAssyrian/Chaldean/SyriacAustralianAustrianBahamianBangladeshiBarbadianBasqueBelgianBelizeanBermudanBhutaneseBlackfeetBolivianBrazilianBritishBritish West IndianBulgarianBurmeseCajunCambodianCanadianCape VerdeanCarpatho RusynCelticCentral AmericanCentral American IndianCherokeeCheyenneChickasawChileanChineseChippewaChoctawColombianColvilleComancheCosta RicanCreeCreekCroatianCrowCubanCypriotCzechCzechoslovakianDanishDelawareDominicanDutchDutch West IndianEastern EuropeanEcuadorianEgyptianEnglishEstonianEthiopianEuropeanFijianFilipinoFinnishFrenchFrench American IndianFrench CanadianGermanGerman RussianGhanaianGreekGuamanian/ChamorroGuatemalanGuyaneseHaitianHmongHonduranHopiHoumaHungarianIcelanderIndian (Asian)IndonesianInupiatIranianIraqiIrishIroquoisIsraeliItalianJamaicanJapaneseJordanianKenyanKiowaKoreanLaotianLatvianLebaneseLiberianLithuanianLumbeeLuxembourgerMacedonianMalaysianMalteseMarshalleseMenomineeMexicanMexican American IndianMongolianMoroccanNative HawaiianNavajoNepaleseNew ZealanderNicaraguanNigerianNorthern EuropeanNorwegianOkinawanOsageOttawaPaiutePakistaniPalestinianPanamanianParaguayanPennsylvania GermanPeruvianPimaPolishPortuguesePotawatomiPuebloPuget Sound SalishRomanianRussianSalvadoranSamoanScandinavianScotch-IrishScottishSeminoleSenegaleseSerbianShoshoneSierra LeoneanSiouxSlavicSlovakSloveneSomaliSouth AfricanSouth AmericanSouth American IndianSoviet UnionSpaniardSpanishSpanish AmericanSpanish American IndianSri LankanSubsaharan AfricanSudaneseSwedishSwissSyrianTaiwaneseThaiTlingit-HaidaTohono O'OdhamTonganTrinidadian and TobagonianTsimshianTurkishU.S. Virgin IslanderUgandanUkrainianUruguayanUteVenezuelanVietnameseWelshWest IndianYakamaYaquiYugoslavianYumanYup'ikZimbabwean
Immigration
NonimmigrantsImmigrantsAfghanistanAfricaAlbaniaArgentinaArmeniaAsiaAustraliaAustriaBahamasBangladeshBarbadosBelarusBelgiumBelizeBoliviaBosnia and HerzegovinaBrazilBulgariaBurma/MyanmarCabo VerdeCambodiaCameroonCanadaCaribbeanCentral AmericaChileChinaColombiaCongoCosta RicaCroatiaCubaCzechoslovakiaDenmarkDominicaDominican RepublicEastern AfricaEastern AsiaEastern EuropeEcuadorEgyptEl SalvadorEnglandEritreaEthiopiaEuropeFijiFranceGermanyGhanaGreeceGrenadaGuatemalaGuyanaHaitiHondurasHong KongHungaryIndiaIndonesiaIranIraqIrelandIsraelItalyJamaicaJapanJordanKazakhstanKenyaKoreaKuwaitLaosLatin AmericaLatviaLebanonLiberiaLithuaniaMalaysiaMexicoMicronesiaMiddle AfricaMoldovaMoroccoNepalNetherlandsNicaraguaNigeriaNorth AmericaNorth MacedoniaNorthern AfricaNorthern EuropeNorwayOceaniaPakistanPanamaPeruPhilippinesPolandPortugalRomaniaRussiaSaudi ArabiaScotlandSenegalSerbiaSierra LeoneSingaporeSomaliaSouth AfricaSouth AmericaSouth Central AsiaSouth Eastern AsiaSouthern EuropeSpainSri LankaSt. Vincent and the GrenadinesSudanSwedenSwitzerlandSyriaTaiwanThailandTrinidad and TobagoTurkeyUgandaUkraineUruguayUzbekistanVenezuelaVietnamWest IndiesWestern AfricaWestern AsiaWestern EuropeYemenZaireZimbabweAzores
Kindergarten
Income
Poverty
Unemployment
Labor Participation
Family Structure
Vehicle Availability
Education Level
Disability

Kindergarten Comparison

Puerto Ricans

Immigrants from Czechoslovakia

Tragic
Exceptional
97.7%
KINDERGARTEN
2.7/ 100
METRIC RATING
231st/ 347
METRIC RANK
98.2%
KINDERGARTEN
96.6/ 100
METRIC RATING
112th/ 347
METRIC RANK

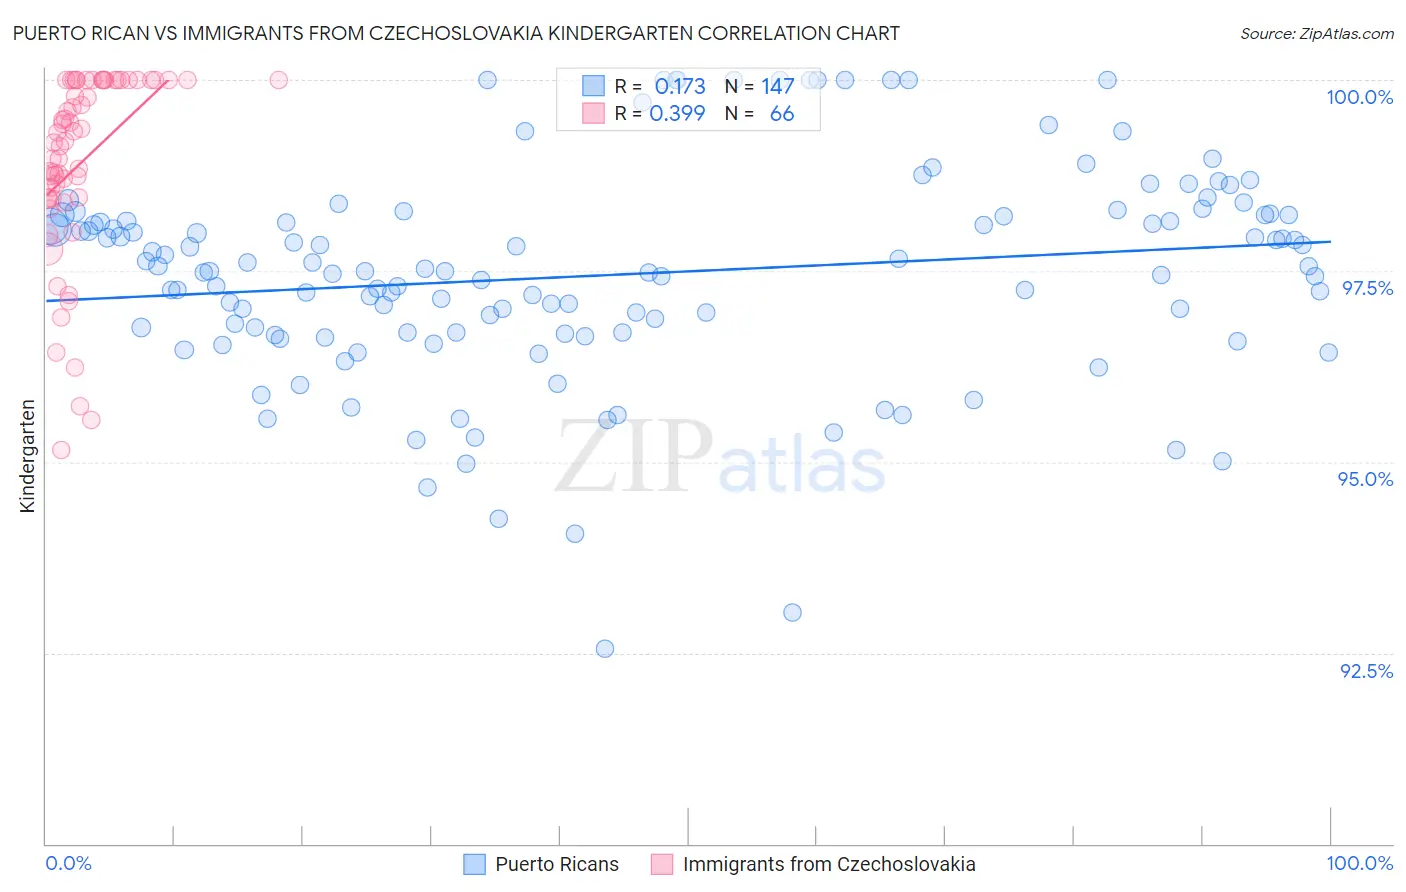
Puerto Rican vs Immigrants from Czechoslovakia Kindergarten Correlation Chart

The statistical analysis conducted on geographies consisting of 528,320,522 people shows a poor positive correlation between the proportion of Puerto Ricans and percentage of population with at least kindergarten education in the United States with a correlation coefficient (R) of 0.173 and weighted average of 97.7%. Similarly, the statistical analysis conducted on geographies consisting of 195,448,060 people shows a mild positive correlation between the proportion of Immigrants from Czechoslovakia and percentage of population with at least kindergarten education in the United States with a correlation coefficient (R) of 0.399 and weighted average of 98.2%, a difference of 0.53%.
Puerto Rican vs Immigrants from Czechoslovakia Kindergarten

Kindergarten Correlation Summary

MeasurementPuerto RicanImmigrants from Czechoslovakia
Minimum92.6%95.2%
Maximum100.0%100.0%
Range7.4%4.8%
Mean97.5%98.9%
Median97.5%99.3%
Interquartile 25% (IQ1)96.7%98.5%
Interquartile 75% (IQ3)98.2%100.0%
Interquartile Range (IQR)1.5%1.5%
Standard Deviation (Sample)1.4%1.2%
Standard Deviation (Population)1.4%1.2%

Similar Demographics by Kindergarten

Demographics Similar to Puerto Ricans by Kindergarten

In terms of kindergarten, the demographic groups most similar to Puerto Ricans are Immigrants from Uruguay (97.7%, a difference of 0.010%), Sudanese (97.7%, a difference of 0.020%), Immigrants from Costa Rica (97.7%, a difference of 0.020%), Subsaharan African (97.7%, a difference of 0.020%), and Sierra Leonean (97.7%, a difference of 0.020%).
DemographicsRating | RankKindergarten
Iraqis
3.9
/100
|
#224
Tragic
97.7%
Immigrants | Nepal
3.8
/100
|
#225
Tragic
97.7%
Sudanese
3.7
/100
|
#226
Tragic
97.7%
Immigrants | Costa Rica
3.6
/100
|
#227
Tragic
97.7%
Sub-Saharan Africans
3.5
/100
|
#228
Tragic
97.7%
Sierra Leoneans
3.4
/100
|
#229
Tragic
97.7%
Senegalese
3.3
/100
|
#230
Tragic
97.7%
Puerto Ricans
2.7
/100
|
#231
Tragic
97.7%
Immigrants | Uruguay
2.6
/100
|
#232
Tragic
97.7%
Immigrants | Pakistan
2.2
/100
|
#233
Tragic
97.7%
Immigrants | Malaysia
2.2
/100
|
#234
Tragic
97.7%
Colombians
2.2
/100
|
#235
Tragic
97.7%
Immigrants | Western Asia
2.1
/100
|
#236
Tragic
97.7%
Nigerians
1.8
/100
|
#237
Tragic
97.6%
Immigrants | Eastern Asia
1.7
/100
|
#238
Tragic
97.6%

Demographics Similar to Immigrants from Czechoslovakia by Kindergarten

In terms of kindergarten, the demographic groups most similar to Immigrants from Czechoslovakia are Immigrants from Singapore (98.2%, a difference of 0.0%), Immigrants from Norway (98.2%, a difference of 0.0%), German Russian (98.2%, a difference of 0.010%), Immigrants from Latvia (98.2%, a difference of 0.010%), and Ute (98.2%, a difference of 0.010%).
DemographicsRating | RankKindergarten
Pima
97.3
/100
|
#105
Exceptional
98.2%
Basques
97.3
/100
|
#106
Exceptional
98.2%
Turks
97.3
/100
|
#107
Exceptional
98.2%
Immigrants | Switzerland
97.2
/100
|
#108
Exceptional
98.2%
German Russians
97.1
/100
|
#109
Exceptional
98.2%
Immigrants | Singapore
96.8
/100
|
#110
Exceptional
98.2%
Immigrants | Norway
96.6
/100
|
#111
Exceptional
98.2%
Immigrants | Czechoslovakia
96.6
/100
|
#112
Exceptional
98.2%
Immigrants | Latvia
96.3
/100
|
#113
Exceptional
98.2%
Ute
96.3
/100
|
#114
Exceptional
98.2%
Iranians
96.2
/100
|
#115
Exceptional
98.2%
Spanish
95.8
/100
|
#116
Exceptional
98.2%
Immigrants | France
95.5
/100
|
#117
Exceptional
98.2%
Yugoslavians
95.5
/100
|
#118
Exceptional
98.2%
Thais
94.8
/100
|
#119
Exceptional
98.2%