Puerto Rican vs Colombian Doctorate Degree
COMPARE
Puerto Rican
Colombian
Doctorate Degree
Doctorate Degree Comparison
Puerto Ricans
Colombians
1.4%
DOCTORATE DEGREE
0.1/ 100
METRIC RATING
298th/ 347
METRIC RANK
1.7%
DOCTORATE DEGREE
16.1/ 100
METRIC RATING
208th/ 347
METRIC RANK
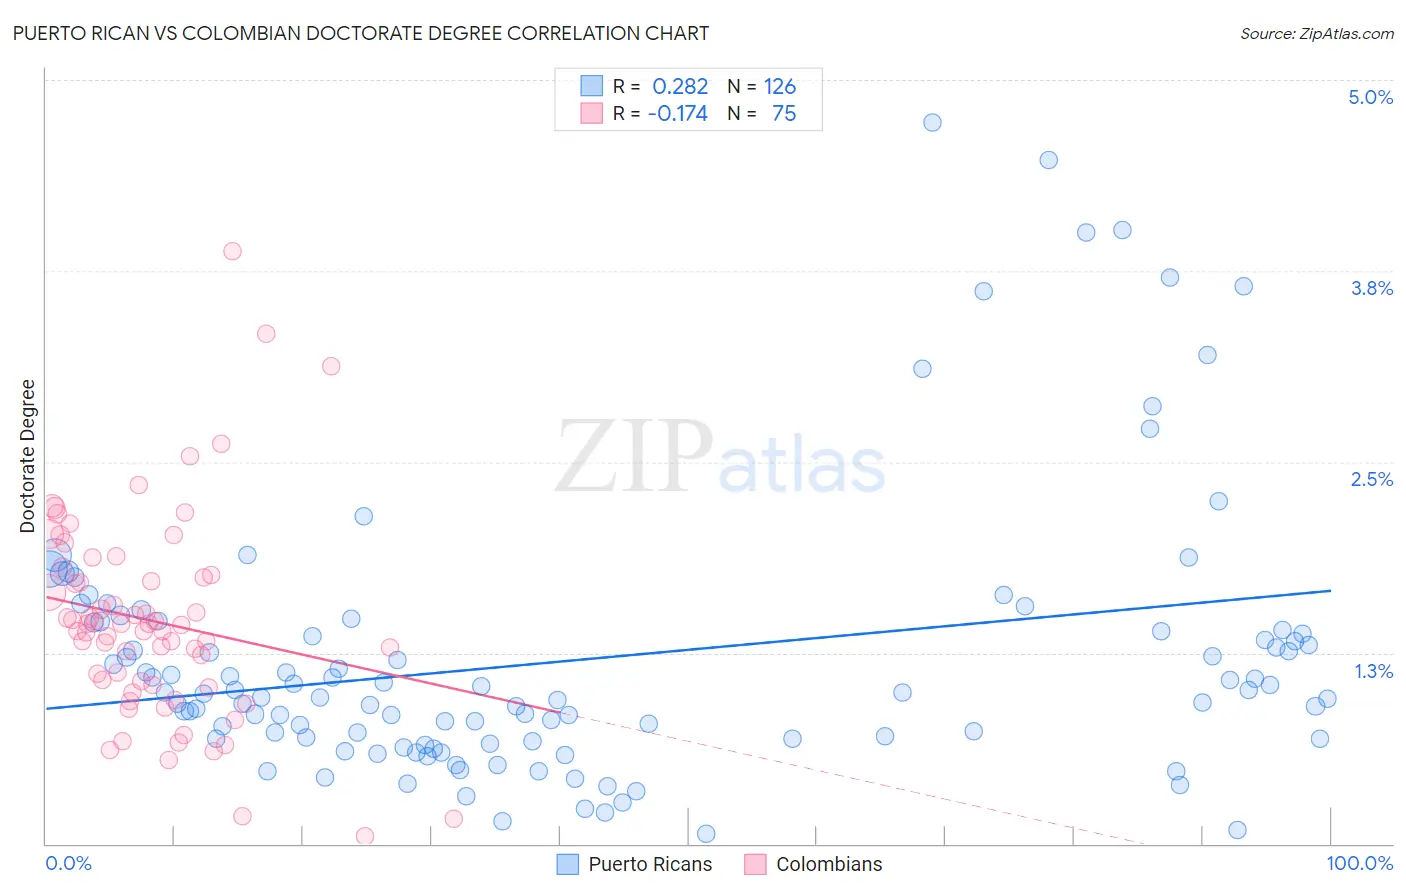
Puerto Rican vs Colombian Doctorate Degree Correlation Chart
The statistical analysis conducted on geographies consisting of 514,802,619 people shows a weak positive correlation between the proportion of Puerto Ricans and percentage of population with at least doctorate degree education in the United States with a correlation coefficient (R) of 0.282 and weighted average of 1.4%. Similarly, the statistical analysis conducted on geographies consisting of 415,824,999 people shows a poor negative correlation between the proportion of Colombians and percentage of population with at least doctorate degree education in the United States with a correlation coefficient (R) of -0.174 and weighted average of 1.7%, a difference of 23.4%.
Doctorate Degree Correlation Summary
| Measurement | Puerto Rican | Colombian |
| Minimum | 0.063% | 0.049% |
| Maximum | 4.7% | 3.9% |
| Range | 4.7% | 3.8% |
| Mean | 1.2% | 1.5% |
| Median | 0.99% | 1.4% |
| Interquartile 25% (IQ1) | 0.69% | 1.0% |
| Interquartile 75% (IQ3) | 1.4% | 1.8% |
| Interquartile Range (IQR) | 0.71% | 0.72% |
| Standard Deviation (Sample) | 0.89% | 0.67% |
| Standard Deviation (Population) | 0.89% | 0.67% |
Similar Demographics by Doctorate Degree
Demographics Similar to Puerto Ricans by Doctorate Degree
In terms of doctorate degree, the demographic groups most similar to Puerto Ricans are Tsimshian (1.4%, a difference of 0.41%), Belizean (1.4%, a difference of 0.43%), Immigrants from Ecuador (1.4%, a difference of 0.63%), Immigrants from Guatemala (1.4%, a difference of 0.76%), and Honduran (1.4%, a difference of 0.83%).
| Demographics | Rating | Rank | Doctorate Degree |
| Blacks/African Americans | 0.3 /100 | #291 | Tragic 1.4% |
| Alaska Natives | 0.3 /100 | #292 | Tragic 1.4% |
| Immigrants | Yemen | 0.2 /100 | #293 | Tragic 1.4% |
| Samoans | 0.2 /100 | #294 | Tragic 1.4% |
| Guatemalans | 0.2 /100 | #295 | Tragic 1.4% |
| Immigrants | Ecuador | 0.2 /100 | #296 | Tragic 1.4% |
| Tsimshian | 0.2 /100 | #297 | Tragic 1.4% |
| Puerto Ricans | 0.1 /100 | #298 | Tragic 1.4% |
| Belizeans | 0.1 /100 | #299 | Tragic 1.4% |
| Immigrants | Guatemala | 0.1 /100 | #300 | Tragic 1.4% |
| Hondurans | 0.1 /100 | #301 | Tragic 1.4% |
| Shoshone | 0.1 /100 | #302 | Tragic 1.4% |
| Immigrants | Dominica | 0.1 /100 | #303 | Tragic 1.4% |
| Mexican American Indians | 0.1 /100 | #304 | Tragic 1.4% |
| Pennsylvania Germans | 0.1 /100 | #305 | Tragic 1.4% |
Demographics Similar to Colombians by Doctorate Degree
In terms of doctorate degree, the demographic groups most similar to Colombians are Immigrants from Western Africa (1.7%, a difference of 0.19%), Tongan (1.7%, a difference of 0.27%), Yugoslavian (1.7%, a difference of 0.28%), Immigrants from Armenia (1.7%, a difference of 0.29%), and Immigrants from South Eastern Asia (1.7%, a difference of 0.41%).
| Demographics | Rating | Rank | Doctorate Degree |
| Immigrants | Nigeria | 22.4 /100 | #201 | Fair 1.8% |
| Portuguese | 21.4 /100 | #202 | Fair 1.8% |
| Immigrants | Vietnam | 21.4 /100 | #203 | Fair 1.8% |
| Somalis | 21.2 /100 | #204 | Fair 1.7% |
| Venezuelans | 19.5 /100 | #205 | Poor 1.7% |
| Immigrants | Peru | 17.6 /100 | #206 | Poor 1.7% |
| Yugoslavians | 17.1 /100 | #207 | Poor 1.7% |
| Colombians | 16.1 /100 | #208 | Poor 1.7% |
| Immigrants | Western Africa | 15.4 /100 | #209 | Poor 1.7% |
| Tongans | 15.1 /100 | #210 | Poor 1.7% |
| Immigrants | Armenia | 15.1 /100 | #211 | Poor 1.7% |
| Immigrants | South Eastern Asia | 14.7 /100 | #212 | Poor 1.7% |
| Koreans | 14.2 /100 | #213 | Poor 1.7% |
| Pueblo | 14.2 /100 | #214 | Poor 1.7% |
| Alaskan Athabascans | 13.8 /100 | #215 | Poor 1.7% |