Portuguese vs Immigrants from Croatia Master's Degree
COMPARE
Portuguese
Immigrants from Croatia
Master's Degree
Master's Degree Comparison
Portuguese
Immigrants from Croatia
13.9%
MASTER'S DEGREE
11.2/ 100
METRIC RATING
225th/ 347
METRIC RANK
17.3%
MASTER'S DEGREE
99.3/ 100
METRIC RATING
86th/ 347
METRIC RANK
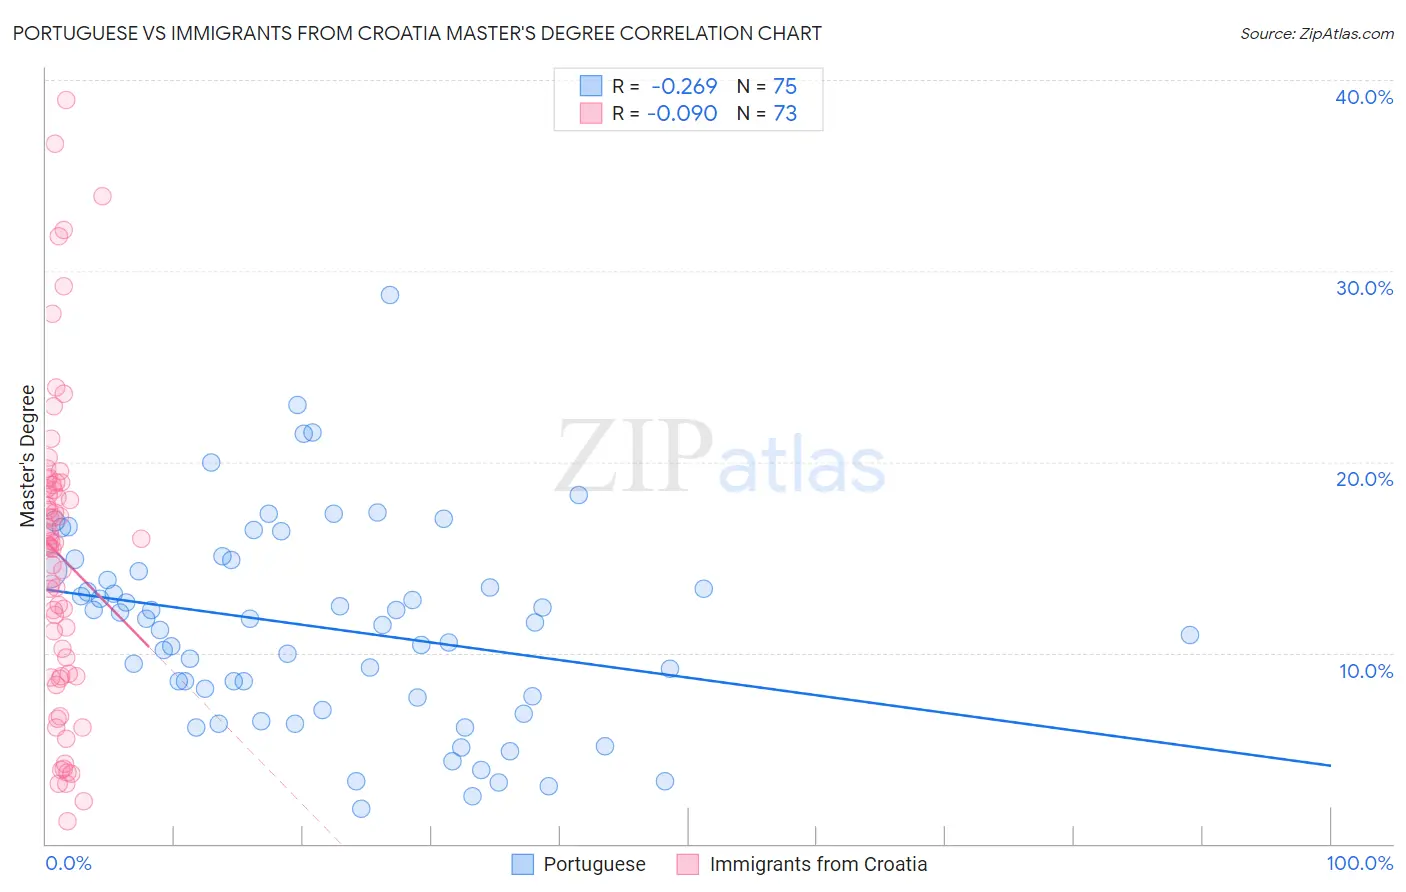
Portuguese vs Immigrants from Croatia Master's Degree Correlation Chart
The statistical analysis conducted on geographies consisting of 450,138,380 people shows a weak negative correlation between the proportion of Portuguese and percentage of population with at least master's degree education in the United States with a correlation coefficient (R) of -0.269 and weighted average of 13.9%. Similarly, the statistical analysis conducted on geographies consisting of 132,554,836 people shows a slight negative correlation between the proportion of Immigrants from Croatia and percentage of population with at least master's degree education in the United States with a correlation coefficient (R) of -0.090 and weighted average of 17.3%, a difference of 24.0%.
Master's Degree Correlation Summary
| Measurement | Portuguese | Immigrants from Croatia |
| Minimum | 1.8% | 1.2% |
| Maximum | 28.7% | 39.0% |
| Range | 26.9% | 37.8% |
| Mean | 11.3% | 15.1% |
| Median | 11.6% | 15.7% |
| Interquartile 25% (IQ1) | 7.6% | 8.8% |
| Interquartile 75% (IQ3) | 14.3% | 18.8% |
| Interquartile Range (IQR) | 6.7% | 10.1% |
| Standard Deviation (Sample) | 5.3% | 8.2% |
| Standard Deviation (Population) | 5.2% | 8.1% |
Similar Demographics by Master's Degree
Demographics Similar to Portuguese by Master's Degree
In terms of master's degree, the demographic groups most similar to Portuguese are Immigrants from St. Vincent and the Grenadines (13.9%, a difference of 0.050%), Immigrants from Grenada (14.0%, a difference of 0.21%), Immigrants from South Eastern Asia (14.0%, a difference of 0.26%), Ecuadorian (14.0%, a difference of 0.46%), and Korean (14.0%, a difference of 0.49%).
| Demographics | Rating | Rank | Master's Degree |
| French Canadians | 14.9 /100 | #218 | Poor 14.1% |
| Norwegians | 13.6 /100 | #219 | Poor 14.0% |
| Germans | 13.1 /100 | #220 | Poor 14.0% |
| Koreans | 12.7 /100 | #221 | Poor 14.0% |
| Ecuadorians | 12.6 /100 | #222 | Poor 14.0% |
| Immigrants | South Eastern Asia | 11.9 /100 | #223 | Poor 14.0% |
| Immigrants | Grenada | 11.8 /100 | #224 | Poor 14.0% |
| Portuguese | 11.2 /100 | #225 | Poor 13.9% |
| Immigrants | St. Vincent and the Grenadines | 11.0 /100 | #226 | Poor 13.9% |
| Immigrants | West Indies | 9.8 /100 | #227 | Tragic 13.9% |
| Whites/Caucasians | 9.1 /100 | #228 | Tragic 13.8% |
| British West Indians | 8.8 /100 | #229 | Tragic 13.8% |
| Dutch | 8.7 /100 | #230 | Tragic 13.8% |
| Guyanese | 7.6 /100 | #231 | Tragic 13.7% |
| Immigrants | Philippines | 6.0 /100 | #232 | Tragic 13.6% |
Demographics Similar to Immigrants from Croatia by Master's Degree
In terms of master's degree, the demographic groups most similar to Immigrants from Croatia are Maltese (17.3%, a difference of 0.10%), Immigrants from Brazil (17.4%, a difference of 0.41%), Immigrants from Canada (17.2%, a difference of 0.46%), Bhutanese (17.2%, a difference of 0.53%), and Immigrants from Egypt (17.2%, a difference of 0.55%).
| Demographics | Rating | Rank | Master's Degree |
| Immigrants | Lebanon | 99.6 /100 | #79 | Exceptional 17.5% |
| Carpatho Rusyns | 99.6 /100 | #80 | Exceptional 17.5% |
| Immigrants | Western Asia | 99.5 /100 | #81 | Exceptional 17.5% |
| Greeks | 99.5 /100 | #82 | Exceptional 17.5% |
| Immigrants | Zimbabwe | 99.5 /100 | #83 | Exceptional 17.4% |
| Immigrants | Scotland | 99.4 /100 | #84 | Exceptional 17.4% |
| Immigrants | Brazil | 99.4 /100 | #85 | Exceptional 17.4% |
| Immigrants | Croatia | 99.3 /100 | #86 | Exceptional 17.3% |
| Maltese | 99.3 /100 | #87 | Exceptional 17.3% |
| Immigrants | Canada | 99.2 /100 | #88 | Exceptional 17.2% |
| Bhutanese | 99.1 /100 | #89 | Exceptional 17.2% |
| Immigrants | Egypt | 99.1 /100 | #90 | Exceptional 17.2% |
| Romanians | 99.1 /100 | #91 | Exceptional 17.2% |
| Immigrants | North America | 99.1 /100 | #92 | Exceptional 17.2% |
| Immigrants | Italy | 99.1 /100 | #93 | Exceptional 17.2% |