Portuguese vs Armenian Master's Degree
COMPARE
Portuguese
Armenian
Master's Degree
Master's Degree Comparison
Portuguese
Armenians
13.9%
MASTER'S DEGREE
11.2/ 100
METRIC RATING
225th/ 347
METRIC RANK
16.8%
MASTER'S DEGREE
98.0/ 100
METRIC RATING
107th/ 347
METRIC RANK
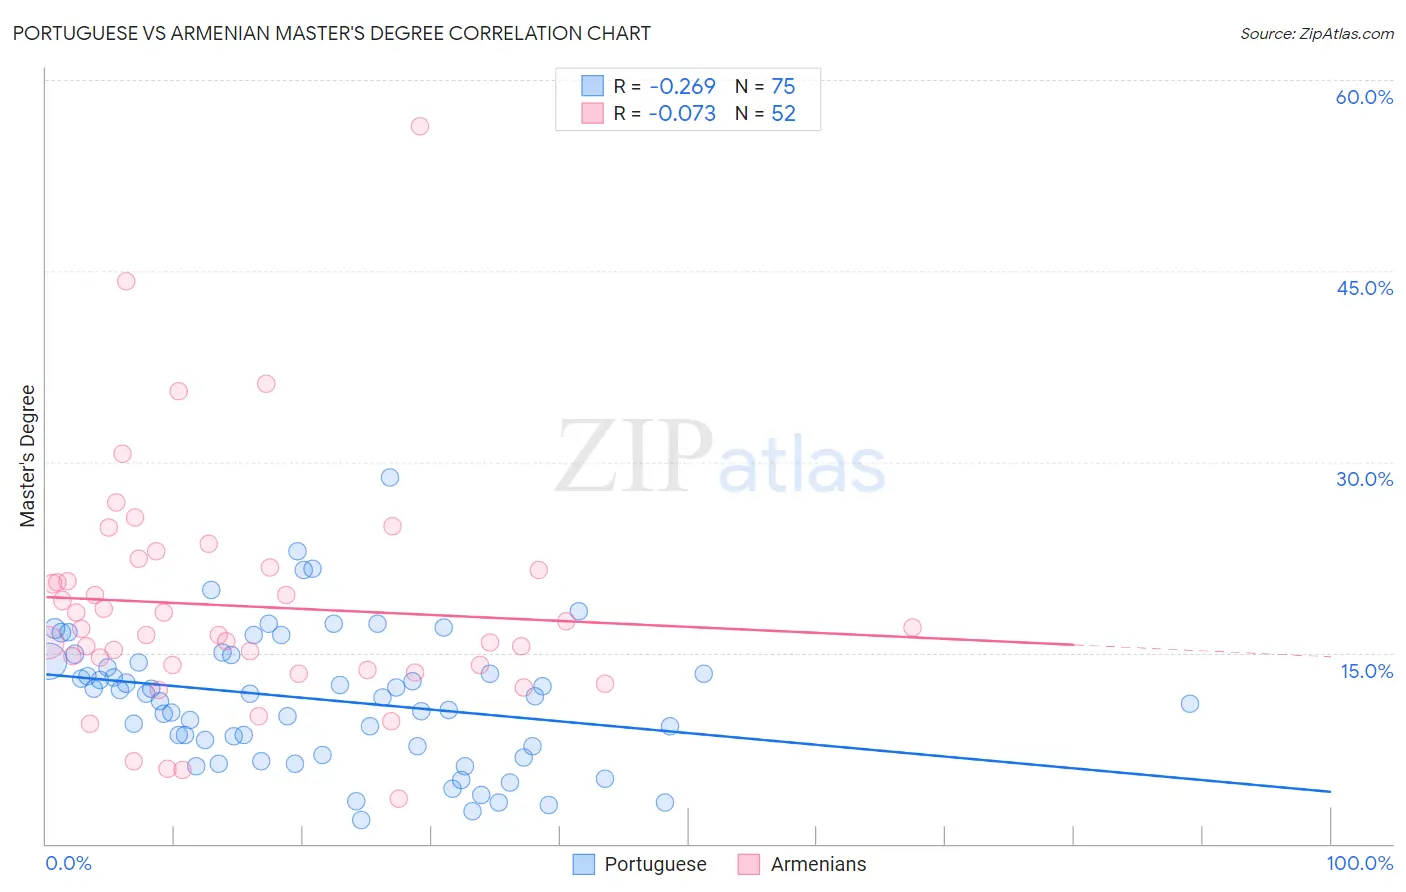
Portuguese vs Armenian Master's Degree Correlation Chart
The statistical analysis conducted on geographies consisting of 450,138,380 people shows a weak negative correlation between the proportion of Portuguese and percentage of population with at least master's degree education in the United States with a correlation coefficient (R) of -0.269 and weighted average of 13.9%. Similarly, the statistical analysis conducted on geographies consisting of 310,885,780 people shows a slight negative correlation between the proportion of Armenians and percentage of population with at least master's degree education in the United States with a correlation coefficient (R) of -0.073 and weighted average of 16.8%, a difference of 20.5%.
Master's Degree Correlation Summary
| Measurement | Portuguese | Armenian |
| Minimum | 1.8% | 3.6% |
| Maximum | 28.7% | 56.3% |
| Range | 26.9% | 52.8% |
| Mean | 11.3% | 18.7% |
| Median | 11.6% | 16.7% |
| Interquartile 25% (IQ1) | 7.6% | 13.8% |
| Interquartile 75% (IQ3) | 14.3% | 21.6% |
| Interquartile Range (IQR) | 6.7% | 7.7% |
| Standard Deviation (Sample) | 5.3% | 9.3% |
| Standard Deviation (Population) | 5.2% | 9.2% |
Similar Demographics by Master's Degree
Demographics Similar to Portuguese by Master's Degree
In terms of master's degree, the demographic groups most similar to Portuguese are Immigrants from St. Vincent and the Grenadines (13.9%, a difference of 0.050%), Immigrants from Grenada (14.0%, a difference of 0.21%), Immigrants from South Eastern Asia (14.0%, a difference of 0.26%), Ecuadorian (14.0%, a difference of 0.46%), and Korean (14.0%, a difference of 0.49%).
| Demographics | Rating | Rank | Master's Degree |
| French Canadians | 14.9 /100 | #218 | Poor 14.1% |
| Norwegians | 13.6 /100 | #219 | Poor 14.0% |
| Germans | 13.1 /100 | #220 | Poor 14.0% |
| Koreans | 12.7 /100 | #221 | Poor 14.0% |
| Ecuadorians | 12.6 /100 | #222 | Poor 14.0% |
| Immigrants | South Eastern Asia | 11.9 /100 | #223 | Poor 14.0% |
| Immigrants | Grenada | 11.8 /100 | #224 | Poor 14.0% |
| Portuguese | 11.2 /100 | #225 | Poor 13.9% |
| Immigrants | St. Vincent and the Grenadines | 11.0 /100 | #226 | Poor 13.9% |
| Immigrants | West Indies | 9.8 /100 | #227 | Tragic 13.9% |
| Whites/Caucasians | 9.1 /100 | #228 | Tragic 13.8% |
| British West Indians | 8.8 /100 | #229 | Tragic 13.8% |
| Dutch | 8.7 /100 | #230 | Tragic 13.8% |
| Guyanese | 7.6 /100 | #231 | Tragic 13.7% |
| Immigrants | Philippines | 6.0 /100 | #232 | Tragic 13.6% |
Demographics Similar to Armenians by Master's Degree
In terms of master's degree, the demographic groups most similar to Armenians are Sierra Leonean (16.8%, a difference of 0.030%), Moroccan (16.8%, a difference of 0.050%), Immigrants from Chile (16.8%, a difference of 0.080%), Immigrants from Albania (16.8%, a difference of 0.090%), and Austrian (16.7%, a difference of 0.35%).
| Demographics | Rating | Rank | Master's Degree |
| Albanians | 98.7 /100 | #100 | Exceptional 17.0% |
| Immigrants | Nepal | 98.6 /100 | #101 | Exceptional 17.0% |
| Chileans | 98.6 /100 | #102 | Exceptional 16.9% |
| Alsatians | 98.4 /100 | #103 | Exceptional 16.9% |
| Ukrainians | 98.3 /100 | #104 | Exceptional 16.9% |
| Syrians | 98.3 /100 | #105 | Exceptional 16.8% |
| Immigrants | Albania | 98.1 /100 | #106 | Exceptional 16.8% |
| Armenians | 98.0 /100 | #107 | Exceptional 16.8% |
| Sierra Leoneans | 98.0 /100 | #108 | Exceptional 16.8% |
| Moroccans | 98.0 /100 | #109 | Exceptional 16.8% |
| Immigrants | Chile | 98.0 /100 | #110 | Exceptional 16.8% |
| Austrians | 97.8 /100 | #111 | Exceptional 16.7% |
| Macedonians | 97.7 /100 | #112 | Exceptional 16.7% |
| Arabs | 97.7 /100 | #113 | Exceptional 16.7% |
| Northern Europeans | 97.6 /100 | #114 | Exceptional 16.7% |