Immigrants from Somalia vs Immigrants from Croatia Master's Degree
COMPARE
Immigrants from Somalia
Immigrants from Croatia
Master's Degree
Master's Degree Comparison
Immigrants from Somalia
Immigrants from Croatia
14.1%
MASTER'S DEGREE
15.8/ 100
METRIC RATING
216th/ 347
METRIC RANK
17.3%
MASTER'S DEGREE
99.3/ 100
METRIC RATING
86th/ 347
METRIC RANK
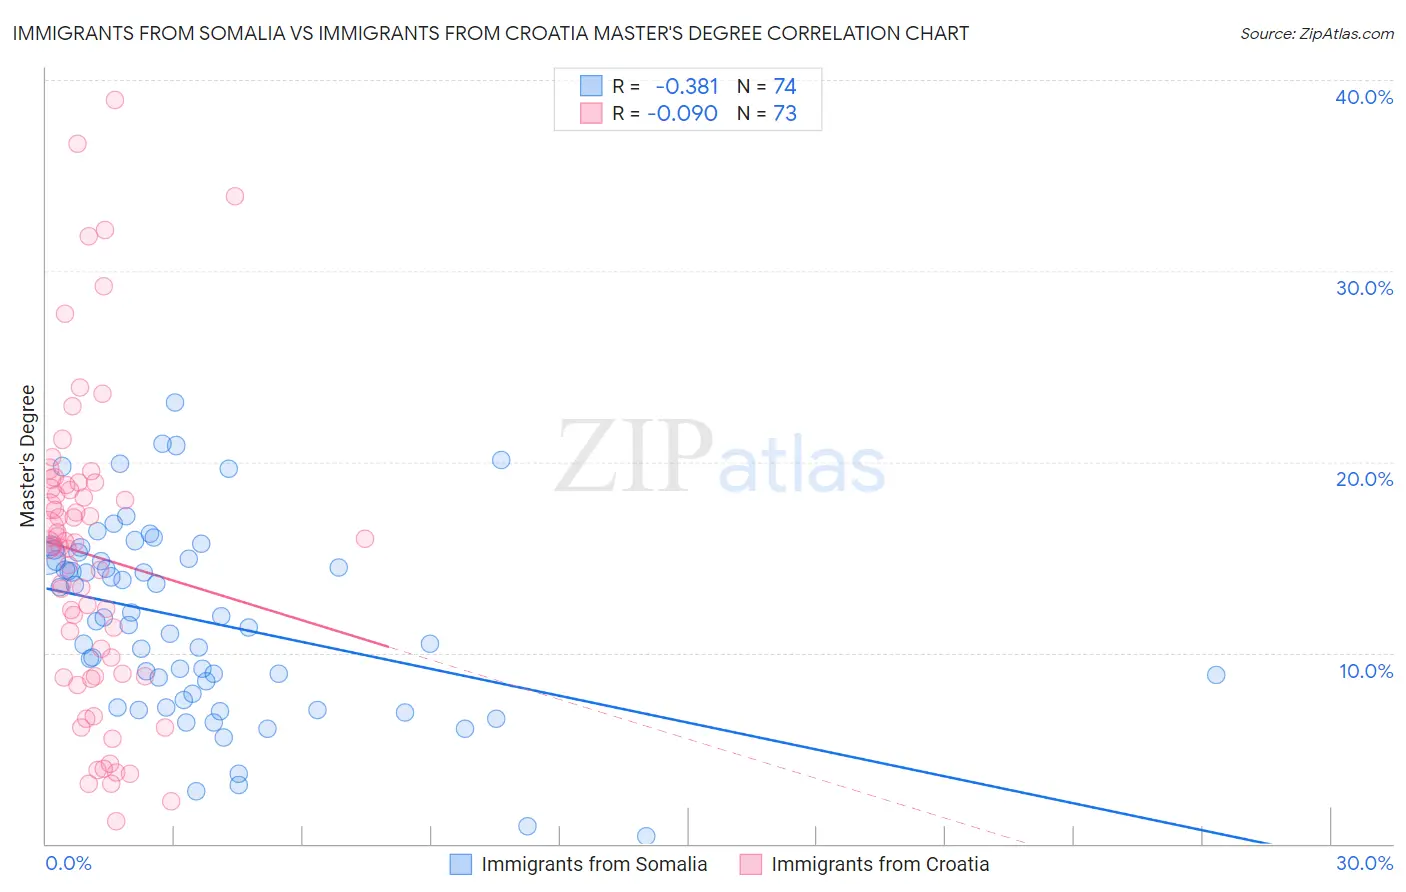
Immigrants from Somalia vs Immigrants from Croatia Master's Degree Correlation Chart
The statistical analysis conducted on geographies consisting of 92,109,960 people shows a mild negative correlation between the proportion of Immigrants from Somalia and percentage of population with at least master's degree education in the United States with a correlation coefficient (R) of -0.381 and weighted average of 14.1%. Similarly, the statistical analysis conducted on geographies consisting of 132,554,836 people shows a slight negative correlation between the proportion of Immigrants from Croatia and percentage of population with at least master's degree education in the United States with a correlation coefficient (R) of -0.090 and weighted average of 17.3%, a difference of 22.4%.
Master's Degree Correlation Summary
| Measurement | Immigrants from Somalia | Immigrants from Croatia |
| Minimum | 0.40% | 1.2% |
| Maximum | 23.1% | 39.0% |
| Range | 22.7% | 37.8% |
| Mean | 11.7% | 15.1% |
| Median | 11.7% | 15.7% |
| Interquartile 25% (IQ1) | 7.9% | 8.8% |
| Interquartile 75% (IQ3) | 15.1% | 18.8% |
| Interquartile Range (IQR) | 7.2% | 10.1% |
| Standard Deviation (Sample) | 4.9% | 8.2% |
| Standard Deviation (Population) | 4.9% | 8.1% |
Similar Demographics by Master's Degree
Demographics Similar to Immigrants from Somalia by Master's Degree
In terms of master's degree, the demographic groups most similar to Immigrants from Somalia are Immigrants from Trinidad and Tobago (14.1%, a difference of 0.0%), Immigrants from Vietnam (14.1%, a difference of 0.070%), French Canadian (14.1%, a difference of 0.25%), Finnish (14.2%, a difference of 0.27%), and Immigrants from Thailand (14.2%, a difference of 0.29%).
| Demographics | Rating | Rank | Master's Degree |
| Immigrants | Panama | 20.0 /100 | #209 | Fair 14.3% |
| Sub-Saharan Africans | 19.4 /100 | #210 | Poor 14.2% |
| Somalis | 18.0 /100 | #211 | Poor 14.2% |
| Spanish | 17.8 /100 | #212 | Poor 14.2% |
| Immigrants | Thailand | 17.0 /100 | #213 | Poor 14.2% |
| Finns | 16.9 /100 | #214 | Poor 14.2% |
| Immigrants | Vietnam | 16.1 /100 | #215 | Poor 14.1% |
| Immigrants | Somalia | 15.8 /100 | #216 | Poor 14.1% |
| Immigrants | Trinidad and Tobago | 15.8 /100 | #217 | Poor 14.1% |
| French Canadians | 14.9 /100 | #218 | Poor 14.1% |
| Norwegians | 13.6 /100 | #219 | Poor 14.0% |
| Germans | 13.1 /100 | #220 | Poor 14.0% |
| Koreans | 12.7 /100 | #221 | Poor 14.0% |
| Ecuadorians | 12.6 /100 | #222 | Poor 14.0% |
| Immigrants | South Eastern Asia | 11.9 /100 | #223 | Poor 14.0% |
Demographics Similar to Immigrants from Croatia by Master's Degree
In terms of master's degree, the demographic groups most similar to Immigrants from Croatia are Maltese (17.3%, a difference of 0.10%), Immigrants from Brazil (17.4%, a difference of 0.41%), Immigrants from Canada (17.2%, a difference of 0.46%), Bhutanese (17.2%, a difference of 0.53%), and Immigrants from Egypt (17.2%, a difference of 0.55%).
| Demographics | Rating | Rank | Master's Degree |
| Immigrants | Lebanon | 99.6 /100 | #79 | Exceptional 17.5% |
| Carpatho Rusyns | 99.6 /100 | #80 | Exceptional 17.5% |
| Immigrants | Western Asia | 99.5 /100 | #81 | Exceptional 17.5% |
| Greeks | 99.5 /100 | #82 | Exceptional 17.5% |
| Immigrants | Zimbabwe | 99.5 /100 | #83 | Exceptional 17.4% |
| Immigrants | Scotland | 99.4 /100 | #84 | Exceptional 17.4% |
| Immigrants | Brazil | 99.4 /100 | #85 | Exceptional 17.4% |
| Immigrants | Croatia | 99.3 /100 | #86 | Exceptional 17.3% |
| Maltese | 99.3 /100 | #87 | Exceptional 17.3% |
| Immigrants | Canada | 99.2 /100 | #88 | Exceptional 17.2% |
| Bhutanese | 99.1 /100 | #89 | Exceptional 17.2% |
| Immigrants | Egypt | 99.1 /100 | #90 | Exceptional 17.2% |
| Romanians | 99.1 /100 | #91 | Exceptional 17.2% |
| Immigrants | North America | 99.1 /100 | #92 | Exceptional 17.2% |
| Immigrants | Italy | 99.1 /100 | #93 | Exceptional 17.2% |