Portuguese vs Honduran High School Diploma
COMPARE
Portuguese
Honduran
High School Diploma
High School Diploma Comparison
Portuguese
Hondurans
88.5%
HIGH SCHOOL DIPLOMA
14.4/ 100
METRIC RATING
208th/ 347
METRIC RANK
83.0%
HIGH SCHOOL DIPLOMA
0.0/ 100
METRIC RATING
327th/ 347
METRIC RANK
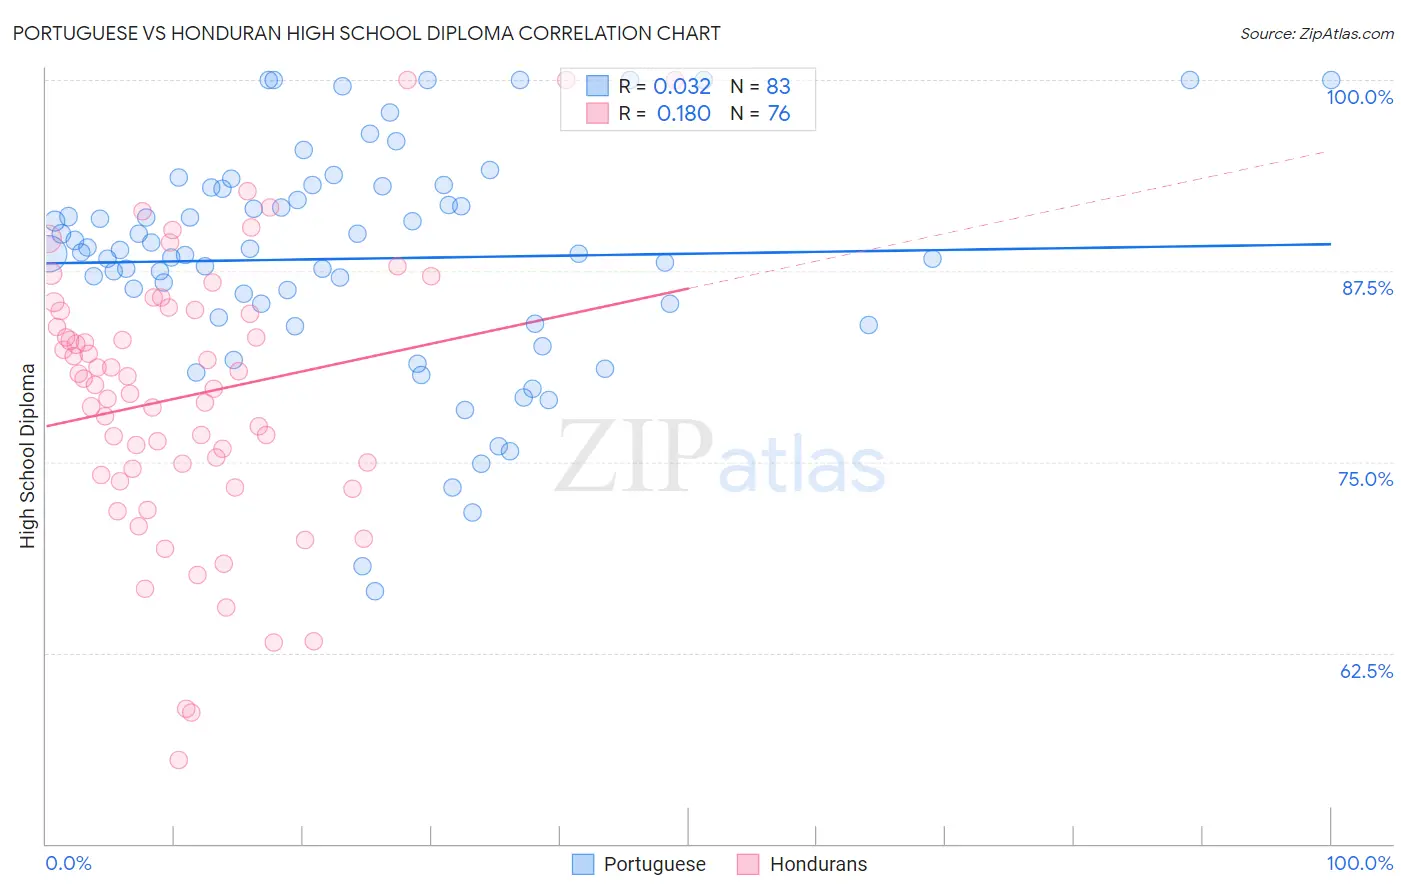
Portuguese vs Honduran High School Diploma Correlation Chart
The statistical analysis conducted on geographies consisting of 450,368,110 people shows no correlation between the proportion of Portuguese and percentage of population with at least high school diploma education in the United States with a correlation coefficient (R) of 0.032 and weighted average of 88.5%. Similarly, the statistical analysis conducted on geographies consisting of 357,858,750 people shows a poor positive correlation between the proportion of Hondurans and percentage of population with at least high school diploma education in the United States with a correlation coefficient (R) of 0.180 and weighted average of 83.0%, a difference of 6.7%.
High School Diploma Correlation Summary
| Measurement | Portuguese | Honduran |
| Minimum | 66.5% | 55.5% |
| Maximum | 100.0% | 100.0% |
| Range | 33.5% | 44.5% |
| Mean | 88.3% | 79.3% |
| Median | 88.7% | 80.2% |
| Interquartile 25% (IQ1) | 84.4% | 74.3% |
| Interquartile 75% (IQ3) | 93.0% | 84.9% |
| Interquartile Range (IQR) | 8.5% | 10.6% |
| Standard Deviation (Sample) | 7.4% | 9.0% |
| Standard Deviation (Population) | 7.3% | 9.0% |
Similar Demographics by High School Diploma
Demographics Similar to Portuguese by High School Diploma
In terms of high school diploma, the demographic groups most similar to Portuguese are Cherokee (88.5%, a difference of 0.0%), Samoan (88.5%, a difference of 0.010%), Immigrants from Sierra Leone (88.6%, a difference of 0.040%), Inupiat (88.5%, a difference of 0.040%), and Arapaho (88.6%, a difference of 0.050%).
| Demographics | Rating | Rank | High School Diploma |
| Koreans | 18.1 /100 | #201 | Poor 88.6% |
| Panamanians | 18.0 /100 | #202 | Poor 88.6% |
| Somalis | 17.5 /100 | #203 | Poor 88.6% |
| Armenians | 17.2 /100 | #204 | Poor 88.6% |
| Immigrants | Micronesia | 16.4 /100 | #205 | Poor 88.6% |
| Arapaho | 16.1 /100 | #206 | Poor 88.6% |
| Immigrants | Sierra Leone | 15.8 /100 | #207 | Poor 88.6% |
| Portuguese | 14.4 /100 | #208 | Poor 88.5% |
| Cherokee | 14.3 /100 | #209 | Poor 88.5% |
| Samoans | 14.0 /100 | #210 | Poor 88.5% |
| Inupiat | 13.1 /100 | #211 | Poor 88.5% |
| South American Indians | 12.2 /100 | #212 | Poor 88.5% |
| Immigrants | Somalia | 11.3 /100 | #213 | Poor 88.4% |
| Immigrants | Cameroon | 10.9 /100 | #214 | Poor 88.4% |
| Crow | 10.9 /100 | #215 | Poor 88.4% |
Demographics Similar to Hondurans by High School Diploma
In terms of high school diploma, the demographic groups most similar to Hondurans are Mexican American Indian (83.0%, a difference of 0.040%), Dominican (82.9%, a difference of 0.050%), Immigrants from Nicaragua (83.1%, a difference of 0.11%), Hispanic or Latino (82.9%, a difference of 0.14%), and Immigrants from the Azores (82.8%, a difference of 0.22%).
| Demographics | Rating | Rank | High School Diploma |
| Nicaraguans | 0.0 /100 | #320 | Tragic 84.1% |
| Yuman | 0.0 /100 | #321 | Tragic 84.0% |
| Lumbee | 0.0 /100 | #322 | Tragic 83.6% |
| Immigrants | Cuba | 0.0 /100 | #323 | Tragic 83.5% |
| Immigrants | Cabo Verde | 0.0 /100 | #324 | Tragic 83.3% |
| Immigrants | Nicaragua | 0.0 /100 | #325 | Tragic 83.1% |
| Mexican American Indians | 0.0 /100 | #326 | Tragic 83.0% |
| Hondurans | 0.0 /100 | #327 | Tragic 83.0% |
| Dominicans | 0.0 /100 | #328 | Tragic 82.9% |
| Hispanics or Latinos | 0.0 /100 | #329 | Tragic 82.9% |
| Immigrants | Azores | 0.0 /100 | #330 | Tragic 82.8% |
| Central Americans | 0.0 /100 | #331 | Tragic 82.5% |
| Immigrants | Honduras | 0.0 /100 | #332 | Tragic 82.5% |
| Immigrants | Latin America | 0.0 /100 | #333 | Tragic 82.1% |
| Tohono O'odham | 0.0 /100 | #334 | Tragic 82.1% |